Technical Analysis of TMFM 2024-05-10
Overview:
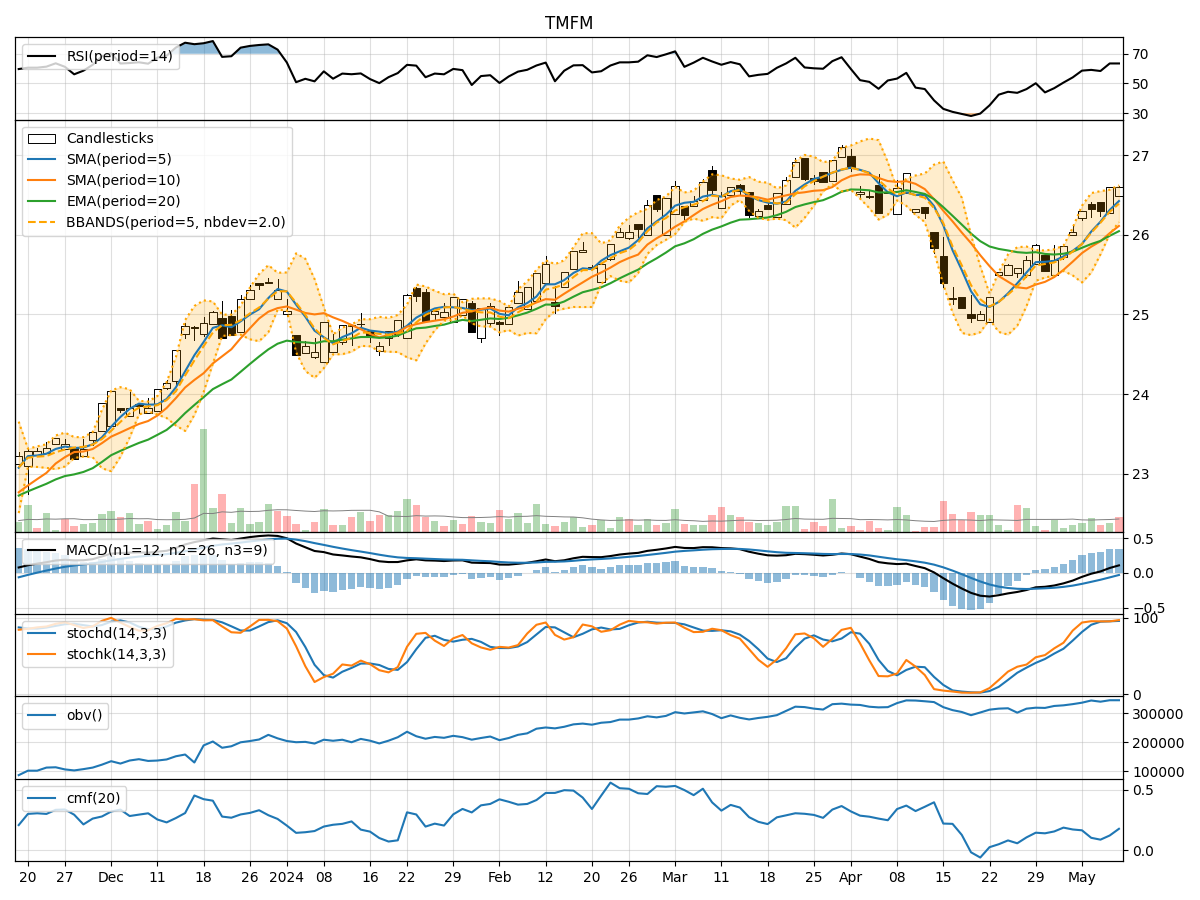
In analyzing the technical indicators for the last 5 days of TMFM stock, we will delve into the trend, momentum, volatility, and volume indicators to provide a comprehensive outlook on the possible stock price movement in the coming days. By examining these key indicators, we aim to offer valuable insights and predictions for potential investors and traders.
Trend Indicators:
- Moving Averages (MA): The moving averages have been showing a consistent uptrend, with the stock price consistently above the short-term moving averages.
- MACD: The MACD line has been consistently above the signal line, indicating a bullish momentum in the stock.
- EMA: The exponential moving average has been trending upwards, reflecting a positive momentum in the stock price.
Key Observation: The trend indicators suggest a strong bullish trend in the stock price.
Momentum Indicators:
- RSI: The Relative Strength Index has been in the overbought territory, indicating a strong buying momentum in the stock.
- Stochastic Oscillator: Both %K and %D lines have been in the overbought zone, suggesting a potential reversal in the stock price.
- Williams %R: The Williams %R has been fluctuating around the oversold territory, indicating a mixed sentiment among traders.
Key Observation: The momentum indicators show a mixed sentiment, with the RSI signaling strong buying momentum but the stochastic oscillator hinting at a possible reversal.
Volatility Indicators:
- Bollinger Bands: The Bollinger Bands have been narrowing, indicating decreasing volatility in the stock price.
- Bollinger %B: The %B indicator has been hovering around the middle range, suggesting a neutral sentiment in the market.
Key Observation: The volatility indicators point towards a period of consolidation and decreased volatility in the stock.
Volume Indicators:
- On-Balance Volume (OBV): The OBV has been relatively stable, indicating a balance between buying and selling pressure.
- Chaikin Money Flow (CMF): The CMF has been positive, suggesting a higher inflow of money into the stock.
Key Observation: The volume indicators reflect a balanced market sentiment with a slight positive bias.
Conclusion:
Based on the analysis of the technical indicators, the stock is likely to experience a period of consolidation in the coming days. The strong bullish trend indicated by the moving averages and MACD may face resistance due to the overbought conditions highlighted by the momentum indicators. The decreasing volatility and balanced volume further support the view of a sideways movement in the stock price.
Recommendation: It is advisable for investors to exercise caution and closely monitor the price action for potential signs of a breakout or reversal. Consider implementing risk management strategies to navigate the anticipated consolidation phase in the stock.