Technical Analysis of TNA 2024-05-10
Overview:
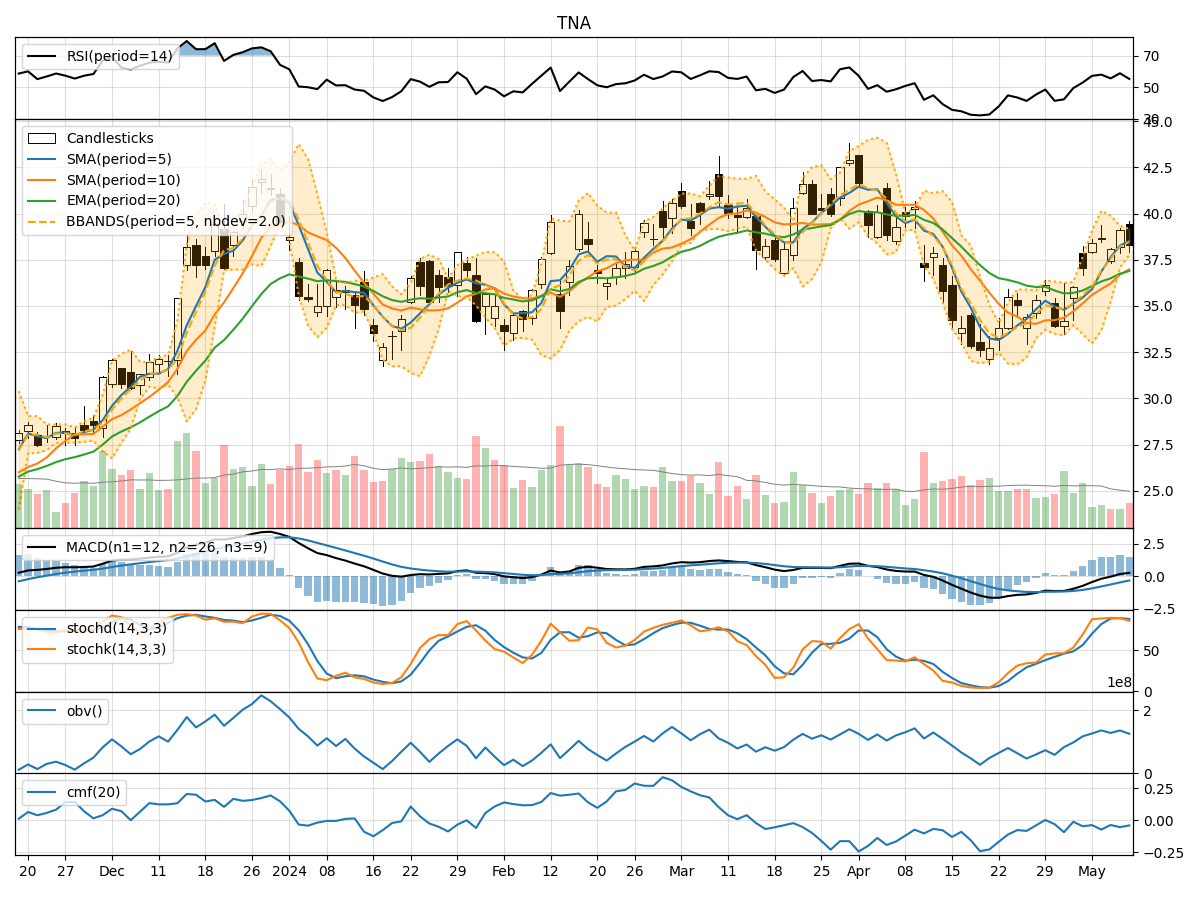
In the last 5 trading days, TNA stock has shown mixed movements in terms of price and volume. The trend indicators suggest a slightly bullish sentiment, with the moving averages trending upwards. Momentum indicators show a mixed picture, with RSI indicating potential strength but stochastic oscillators showing overbought conditions. Volatility indicators suggest decreasing volatility, while volume indicators show a slight decrease in On-Balance Volume (OBV) and Chaikin Money Flow (CMF).
Trend Indicators:
- Moving Averages (MA): The 5-day MA has been consistently above the longer-term SMAs, indicating a short-term bullish trend.
- MACD: The MACD line has been above the signal line, suggesting bullish momentum.
- MACD Histogram: The histogram has been mostly positive, indicating increasing bullish momentum.
Momentum Indicators:
- RSI: The RSI has been fluctuating around the overbought territory, indicating potential strength but also a possibility of a pullback.
- Stochastic Oscillators: Both %K and %D have been in the overbought zone, suggesting a potential reversal or consolidation.
- Williams %R: The indicator has been in the oversold territory, indicating a potential reversal to the upside.
Volatility Indicators:
- Bollinger Bands (BB): The bands have been narrowing, indicating decreasing volatility and a potential breakout in the future.
- BB %B: The %B indicator has been fluctuating around the middle, suggesting a lack of clear trend direction.
Volume Indicators:
- On-Balance Volume (OBV): The OBV has shown a slight decrease, indicating some distribution happening in the stock.
- Chaikin Money Flow (CMF): The CMF has been negative, suggesting a slight outflow of money from the stock.
Key Observations:
- The trend indicators suggest a short-term bullish sentiment, supported by moving averages and MACD.
- Momentum indicators show conflicting signals, with RSI indicating strength but stochastic oscillators suggesting overbought conditions.
- Volatility is decreasing, as shown by the narrowing Bollinger Bands, indicating a potential breakout soon.
- Volume indicators show a slight decrease in OBV and CMF, indicating some distribution.
Conclusion:
Based on the analysis of the technical indicators, the next few days' possible stock price movement for TNA is likely to be sideways with a slight bullish bias. The trend indicators support a bullish sentiment, but the conflicting signals from momentum indicators and the decrease in volume indicators suggest a potential consolidation or sideways movement in the near term. Traders should watch for a breakout from the narrowing Bollinger Bands for a clearer direction.