Technical Analysis of TPHD 2024-05-10
Overview:
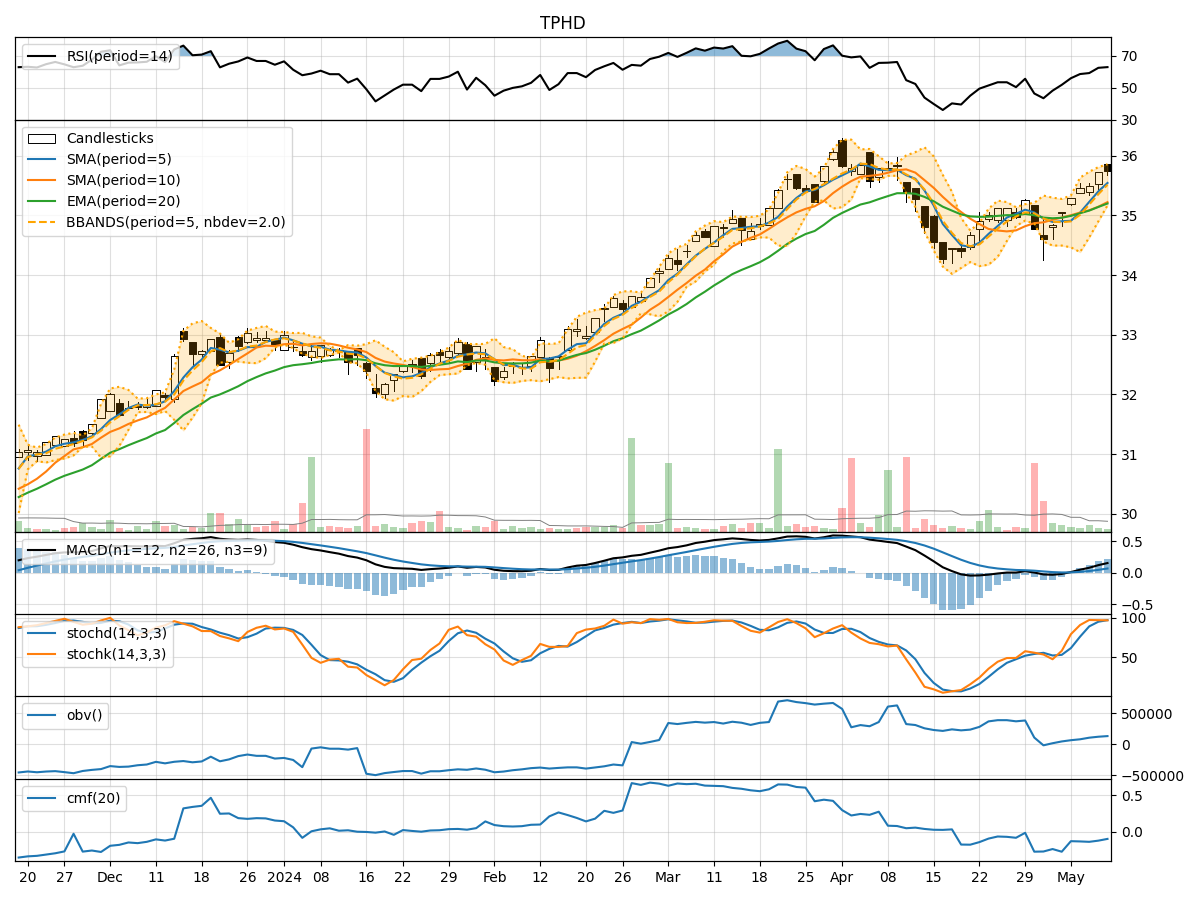
In analyzing the technical indicators for TPHD over the last 5 days, we will delve into the trend, momentum, volatility, and volume indicators to provide a comprehensive outlook on the possible stock price movement in the coming days. By examining these key indicators, we aim to offer valuable insights and predictions for informed decision-making.
Trend Analysis:
- Moving Averages (MA): The 5-day Moving Average (MA) has been consistently above the Simple Moving Average (SMA) and Exponential Moving Average (EMA), indicating a bullish trend.
- MACD: The MACD line has been consistently above the signal line, with both lines showing an upward trend, suggesting bullish momentum.
Momentum Analysis:
- RSI: The Relative Strength Index (RSI) has been trending upwards, indicating increasing buying pressure.
- Stochastic Oscillator: Both %K and %D have been in the overbought zone, suggesting a strong bullish momentum.
Volatility Analysis:
- Bollinger Bands (BB): The stock price has been trading within the upper Bollinger Band, indicating high volatility and potential overbought conditions.
Volume Analysis:
- On-Balance Volume (OBV): The OBV has been steadily increasing, reflecting accumulation by investors.
- Chaikin Money Flow (CMF): The CMF has been negative, indicating selling pressure in the short term.
Key Observations:
- The trend indicators suggest a strong bullish sentiment with moving averages and MACD signaling an upward trend.
- Momentum indicators like RSI and Stochastic Oscillator point towards a continuation of bullish momentum.
- Volatility indicators show high volatility, potentially signaling a period of consolidation or a pullback.
- Volume indicators indicate accumulation by investors but with some short-term selling pressure.
Conclusion:
Based on the analysis of the technical indicators, the next few days for TPHD are likely to see continued upward movement in the stock price. The bullish trend, supported by momentum indicators and increasing buying pressure, suggests that the stock is poised for further gains. However, the high volatility and potential overbought conditions indicated by the Bollinger Bands warrant caution for a possible short-term consolidation or pullback before resuming the uptrend. Investors should closely monitor the price action and key indicators to capitalize on potential opportunities while managing risks effectively.