Technical Analysis of TSLL 2024-05-10
Overview:
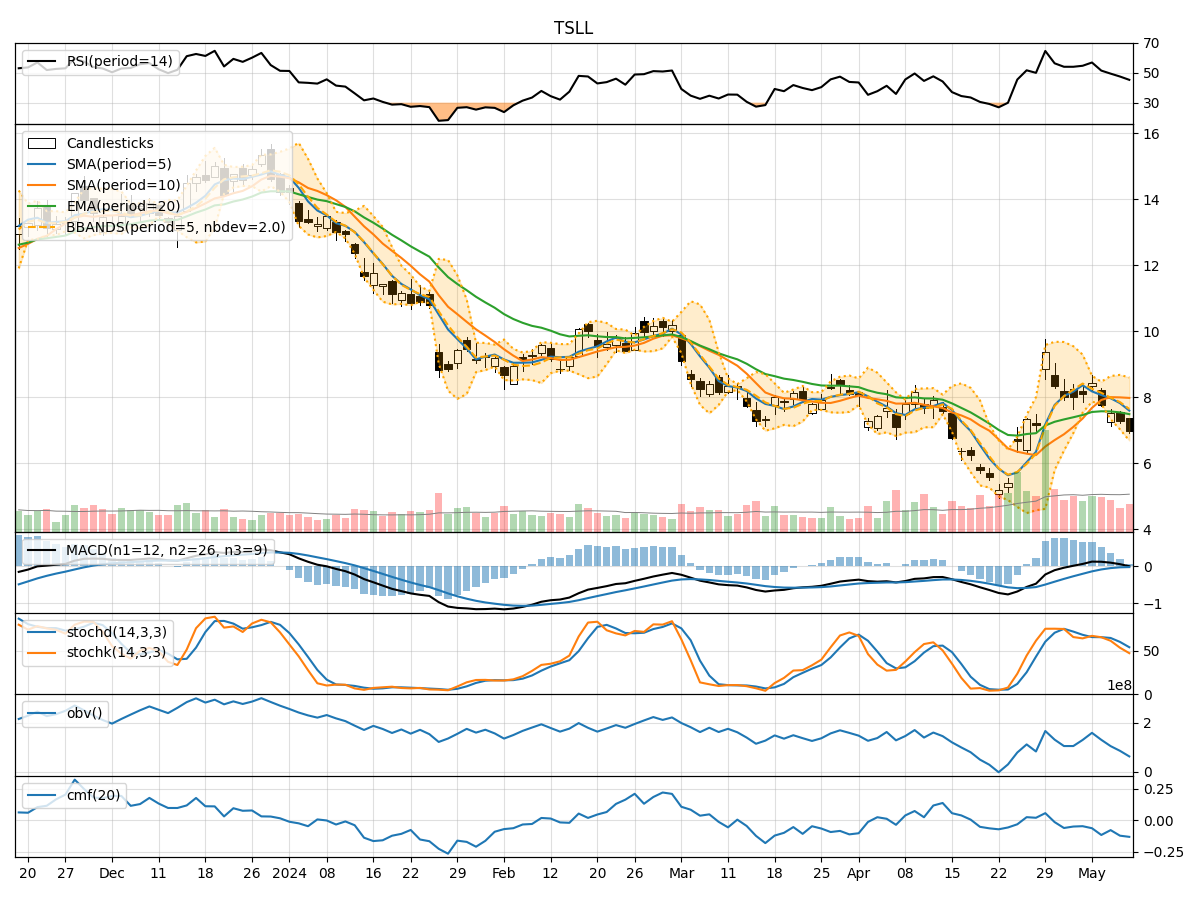
In analyzing the technical indicators for TSLL over the last 5 days, we will delve into the trend, momentum, volatility, and volume indicators to provide a comprehensive outlook on the possible stock price movement in the coming days. By examining these key indicators, we aim to offer valuable insights and predictions for potential investors.
Trend Analysis:
- Moving Averages (MA): The 5-day Moving Average (MA) has been consistently decreasing, indicating a downward trend in the stock price.
- MACD: The MACD line has been negative, suggesting a bearish momentum in the stock.
- RSI: The Relative Strength Index (RSI) has been declining, indicating weakening buying pressure.
Momentum Analysis:
- Stochastic Oscillator: Both %K and %D have been decreasing, signaling a bearish momentum.
- Williams %R: The Williams %R is in oversold territory, indicating a potential reversal or continuation of the downtrend.
Volatility Analysis:
- Bollinger Bands (BB): The Bollinger Bands have been narrowing, suggesting decreasing volatility in the stock price.
- BB% (Bollinger Band Percentage): The BB% has been increasing, indicating a potential breakout or significant price movement.
Volume Analysis:
- On-Balance Volume (OBV): The OBV has been consistently decreasing, reflecting selling pressure in the stock.
- Chaikin Money Flow (CMF): The CMF has been negative, indicating outflow of money from the stock.
Key Observations:
- The stock is currently in a downtrend based on moving averages and MACD.
- Momentum indicators suggest a bearish sentiment with oversold conditions.
- Volatility is decreasing, potentially leading to a period of consolidation.
- Volume indicators show increased selling pressure and negative money flow.
Conclusion:
Based on the analysis of the technical indicators, the next few days' possible stock price movement for TSLL is likely to be downward. The stock is currently in a bearish phase with weakening momentum and increasing selling pressure. Investors should exercise caution and consider waiting for a more favorable entry point before considering any long positions. The overall outlook is bearish, and a continuation of the downtrend is anticipated in the near term.