Technical Analysis of TTT 2024-05-10
Overview:
In analyzing the technical indicators for TTT stock over the last 5 days, we will delve into the trend, momentum, volatility, and volume indicators to provide a comprehensive outlook on the possible stock price movement in the coming days. By examining key metrics such as moving averages, MACD, RSI, Bollinger Bands, and OBV, we aim to offer valuable insights and predictions for informed decision-making.
Trend Indicators:
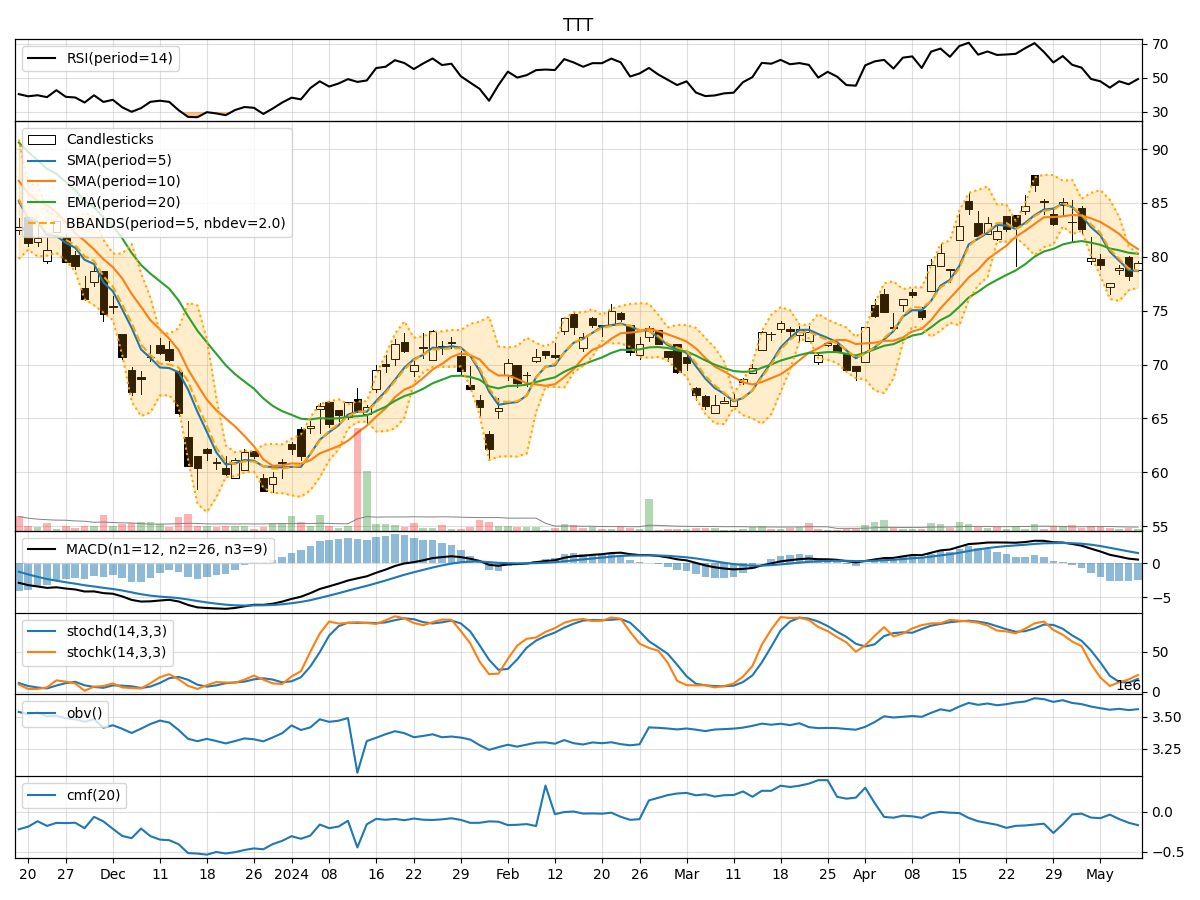
- Moving Averages (MA): The 5-day MA has been consistently below the 10-day SMA, indicating a short-term bearish trend.
- MACD: The MACD line has been decreasing, with the MACD line below the signal line, suggesting a bearish momentum.
- EMA: The EMA has been declining, reflecting a downward trend in the stock price.
Momentum Indicators:
- RSI: The RSI has been hovering around the 50 level, indicating a neutral momentum in the stock.
- Stochastic Oscillator: Both %K and %D have been relatively low, suggesting a lack of strong buying or selling pressure.
- Williams %R: The Williams %R is in oversold territory, indicating a potential reversal in the stock price.
Volatility Indicators:
- Bollinger Bands: The stock price has been trading within the lower Bollinger Band, indicating oversold conditions.
- Bollinger %B: The %B is below 1, signaling a potential buying opportunity as the stock may be undervalued.
- Bollinger Band Width: The Band Width has been narrowing, suggesting a decrease in volatility.
Volume Indicators:
- On-Balance Volume (OBV): The OBV has been declining, indicating selling pressure in the stock.
- Chaikin Money Flow (CMF): The CMF has been negative, reflecting a lack of buying interest in the stock.
Key Observations:
- The stock is currently in a downtrend based on moving averages and MACD.
- Momentum indicators suggest a neutral stance with a potential for a reversal.
- Volatility indicators point towards oversold conditions and a potential buying opportunity.
- Volume indicators indicate selling pressure and a lack of buying interest in the stock.
Conclusion:
Based on the analysis of the technical indicators, the stock is likely to experience further downside movement in the coming days. Traders should exercise caution and consider waiting for a clear reversal signal before considering any long positions. The stock is currently in a bearish phase, and it is advisable to monitor key support levels for potential entry points.