Technical Analysis of TUA 2024-05-10
Overview:
In analyzing the technical indicators for TUA stock over the last 5 days, we will delve into the trend, momentum, volatility, and volume indicators to provide a comprehensive outlook on the possible stock price movement in the coming days. By examining these key indicators, we aim to offer valuable insights and predictions to guide your investment decisions.
Trend Analysis:
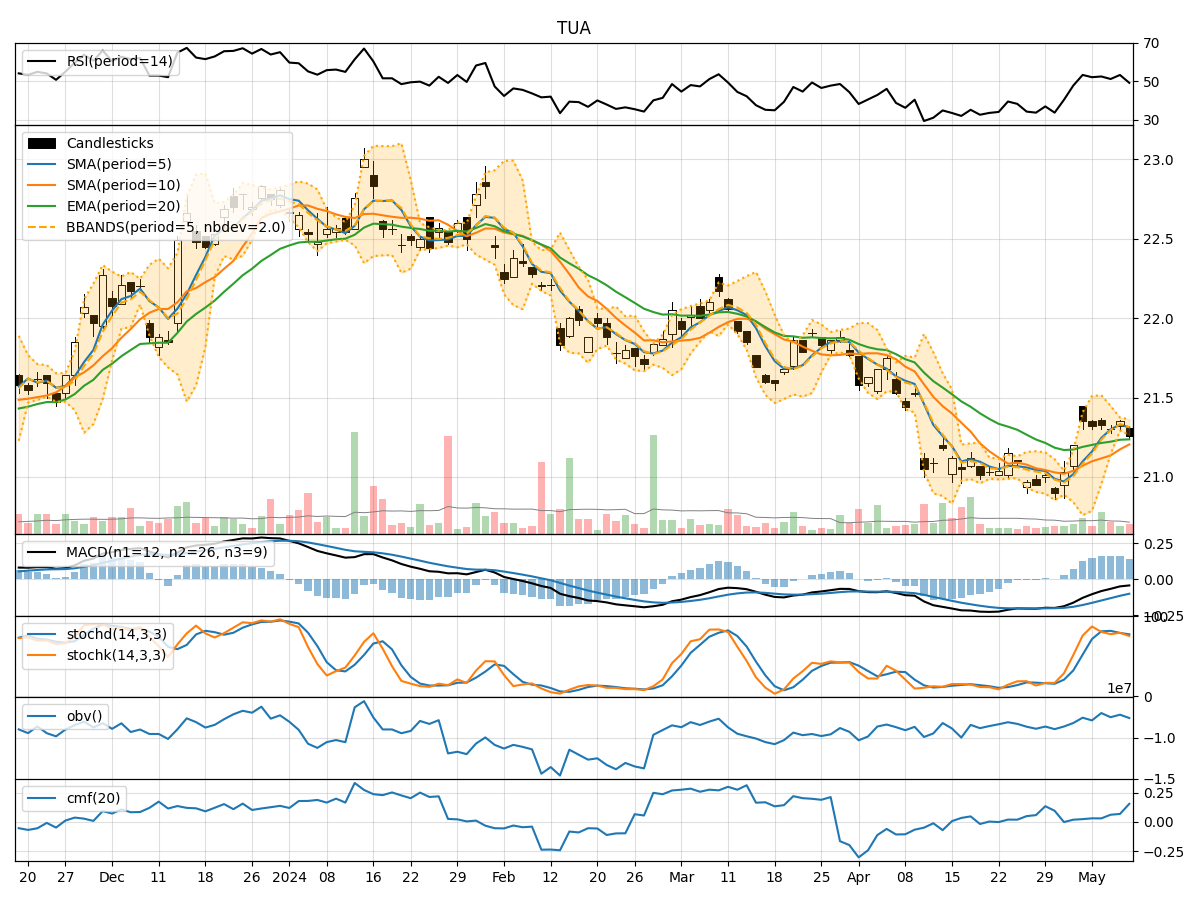
- Moving Averages (MA): The 5-day Moving Average (MA) has been relatively stable around the closing prices, indicating a consistent trend.
- MACD: The Moving Average Convergence Divergence (MACD) has shown a negative trend, with the MACD line consistently below the signal line, suggesting a bearish momentum.
- EMA: The Exponential Moving Average (EMA) has been slightly declining, reflecting a weakening trend.
Momentum Analysis:
- RSI: The Relative Strength Index (RSI) has been fluctuating around the neutral zone, indicating indecision in the market.
- Stochastic Oscillator: Both %K and %D have been decreasing, signaling a potential bearish momentum.
- Williams %R: The Williams %R is in the oversold territory, suggesting a possible reversal in the short term.
Volatility Analysis:
- Bollinger Bands: The Bollinger Bands have been narrowing, indicating decreasing volatility and a potential breakout in the near future.
- Bollinger %B: The %B indicator is hovering around the middle range, reflecting a balanced market sentiment.
Volume Analysis:
- On-Balance Volume (OBV): The OBV has shown mixed signals, with fluctuations in volume accumulation.
- Chaikin Money Flow (CMF): The CMF has been positive, indicating buying pressure in the market.
Key Observations:
- The trend indicators suggest a bearish sentiment, with the MACD and EMA pointing towards a potential downward movement.
- Momentum indicators show a lack of strong direction, with RSI and Stochastic Oscillator reflecting uncertainty.
- Volatility is decreasing, indicating a possible period of consolidation before a breakout.
- Volume indicators are mixed, with OBV showing no clear trend and CMF indicating some buying pressure.
Conclusion:
Based on the analysis of the technical indicators, the stock price of TUA is likely to experience a downward movement in the next few days. The bearish trend indicated by the MACD and EMA, coupled with the lack of strong momentum and decreasing volatility, suggests a period of consolidation or potential decline. Investors should exercise caution and consider waiting for more definitive signals before making any significant trading decisions.