Technical Analysis of TYA 2024-05-10
Overview:
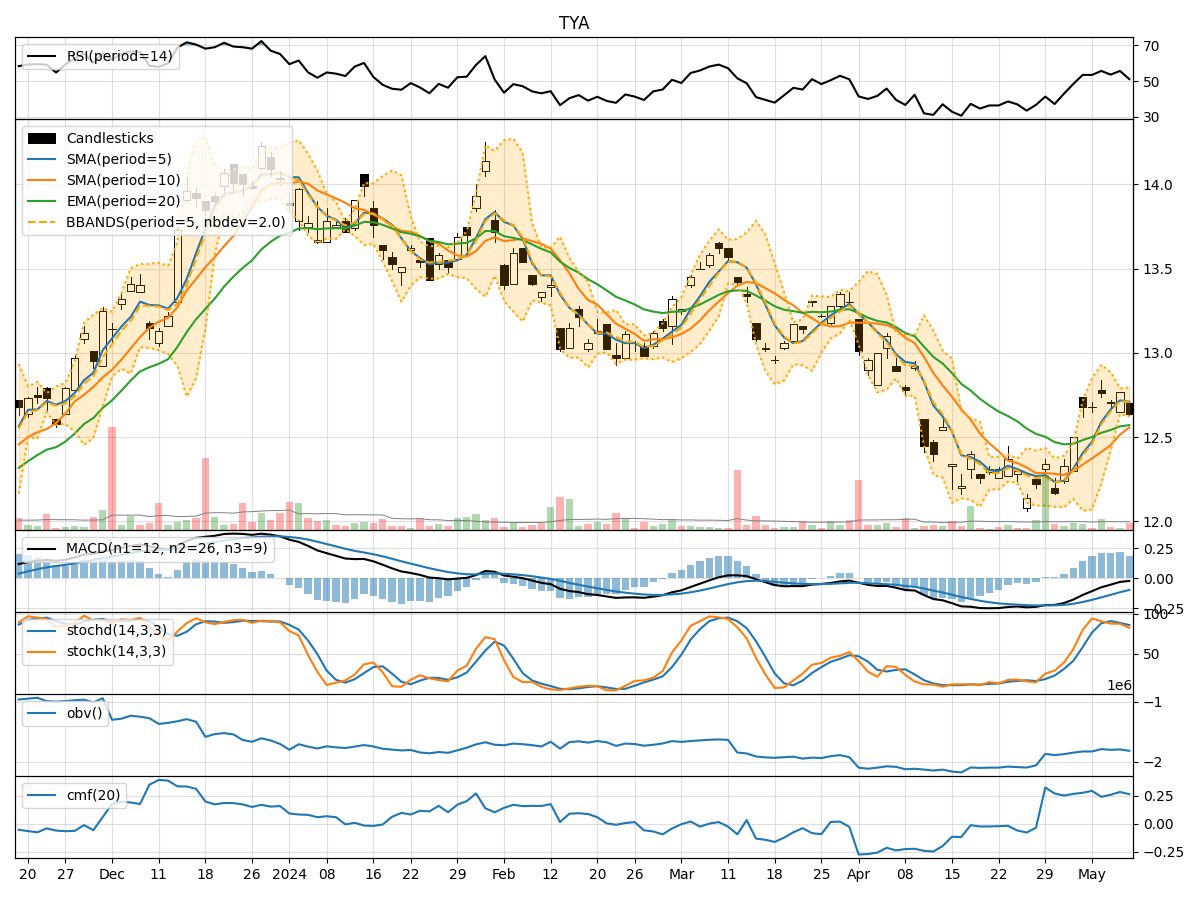
In analyzing the technical indicators for TYA stock over the last 5 days, we will delve into the trend, momentum, volatility, and volume indicators to provide a comprehensive outlook on the possible stock price movement in the coming days. By examining key metrics such as moving averages, MACD, RSI, Bollinger Bands, and OBV, we aim to offer valuable insights and recommendations for potential trading strategies.
Trend Indicators:
- Moving Averages (MA): The 5-day moving average has been trending slightly upwards, indicating a short-term positive momentum in the stock price.
- MACD: The MACD line has been consistently above the signal line, suggesting a bullish trend in the stock.
- EMA: The exponential moving average has been gradually increasing, supporting the bullish sentiment in the short to medium term.
Momentum Indicators:
- RSI: The Relative Strength Index has been hovering around the neutral zone, indicating a balanced momentum in the stock.
- Stochastic Oscillator: Both %K and %D have been declining, signaling a potential reversal in the stock's momentum.
- Williams %R: The Williams %R is in oversold territory, suggesting a possible upcoming bullish reversal.
Volatility Indicators:
- Bollinger Bands: The stock price has been trading within the bands, indicating a period of consolidation and potential breakout in either direction.
- Bollinger %B: The %B indicator is close to the lower band, suggesting a possible oversold condition and a potential bounce back in price.
Volume Indicators:
- On-Balance Volume (OBV): The OBV has been fluctuating, indicating mixed sentiment among investors regarding the stock.
- Chaikin Money Flow (CMF): The CMF has been positive, suggesting that money flow into the stock has been relatively strong.
Key Observations and Opinions:
- Trend: The stock is currently in an upward trend based on moving averages and MACD.
- Momentum: Momentum indicators are showing mixed signals, with RSI neutral, Stochastic indicating a potential reversal, and Williams %R in oversold territory.
- Volatility: Bollinger Bands suggest a period of consolidation, while %B indicates a possible oversold condition.
- Volume: OBV shows mixed sentiment, while CMF indicates positive money flow into the stock.
Conclusion:
Based on the analysis of the technical indicators, the next few days for TYA stock could see upward movement in price. The bullish trend indicated by moving averages and MACD, coupled with the potential reversal signals from momentum indicators like Stochastic and Williams %R, suggest a positive outlook. However, traders should remain cautious of the mixed sentiment in volume indicators and the possibility of a breakout from the consolidation phase indicated by Bollinger Bands. Overall, a bullish bias is recommended for the next few days.