Technical Analysis of TZA 2024-05-10
Overview:
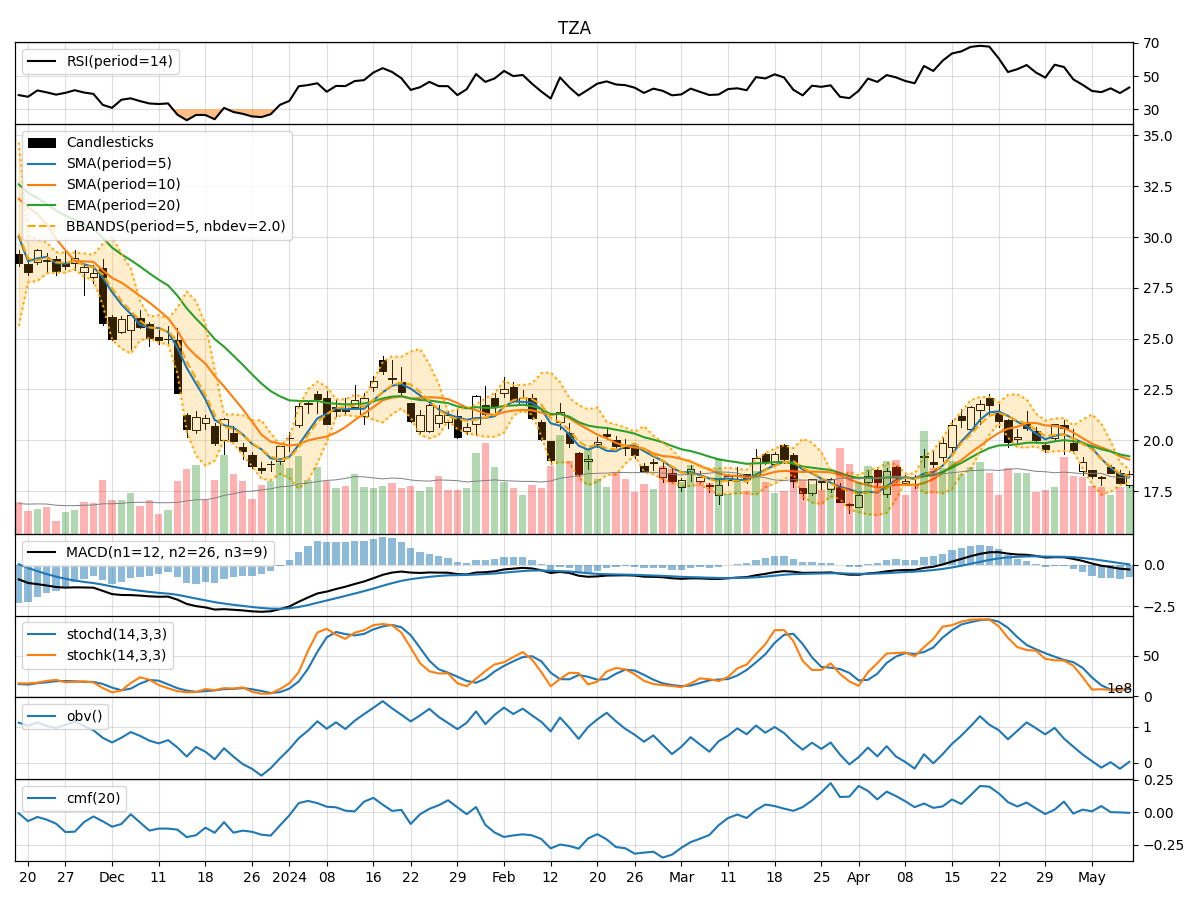
In analyzing the technical indicators for TZA over the last 5 days, we will delve into the trend, momentum, volatility, and volume indicators to provide a comprehensive outlook on the possible stock price movement in the coming days. By examining these key indicators, we aim to offer valuable insights and predictions for informed decision-making.
Trend Analysis:
- Moving Averages (MA): The 5-day MA has been consistently below the SMA(10) and EMA(20), indicating a short-term bearish trend.
- MACD: The MACD line has been below the signal line, with decreasing values over the past 5 days, suggesting a weakening bearish momentum.
- MACD Histogram: The MACD histogram has been negative, indicating a bearish trend.
Momentum Analysis:
- RSI: The RSI has been below 50, indicating bearish momentum in the stock.
- Stochastic Oscillator: Both %K and %D have been in the oversold region, signaling a potential reversal or continuation of the bearish trend.
- Williams %R: The Williams %R has been in the oversold territory, suggesting a bearish sentiment.
Volatility Analysis:
- Bollinger Bands: The stock price has been trading below the lower Bollinger Band, indicating oversold conditions and potential for a reversal.
- Bollinger %B: The %B indicator has been below 0.2, signaling an oversold condition.
- Average True Range (ATR): The ATR has shown a decrease in volatility over the past 5 days.
Volume Analysis:
- On-Balance Volume (OBV): The OBV has been declining, indicating selling pressure in the stock.
- Chaikin Money Flow (CMF): The CMF has been mostly negative, suggesting outflow of money from the stock.
Key Observations and Opinions:
- Trend: The stock is in a short-term bearish trend based on moving averages and MACD analysis.
- Momentum: Momentum indicators suggest a bearish sentiment with oversold conditions.
- Volatility: Volatility has decreased, but oversold conditions may lead to a potential reversal.
- Volume: Selling pressure is evident based on declining OBV and negative CMF.
Conclusion:
Based on the analysis of technical indicators, the stock is likely to experience further downward movement in the coming days. The bearish trend, oversold momentum, and selling pressure indicated by volume indicators all point towards a continuation of the current downward trajectory. Traders and investors should exercise caution and consider shorting or staying away from long positions until there are clear signs of a trend reversal.