Technical Analysis of UCRD 2024-05-10
Overview:
In analyzing the technical indicators for UCRD over the last 5 days, we will delve into the trend, momentum, volatility, and volume indicators to provide a comprehensive outlook on the possible stock price movement in the coming days. By examining these key indicators, we aim to offer valuable insights and predictions for potential investors.
Trend Analysis:
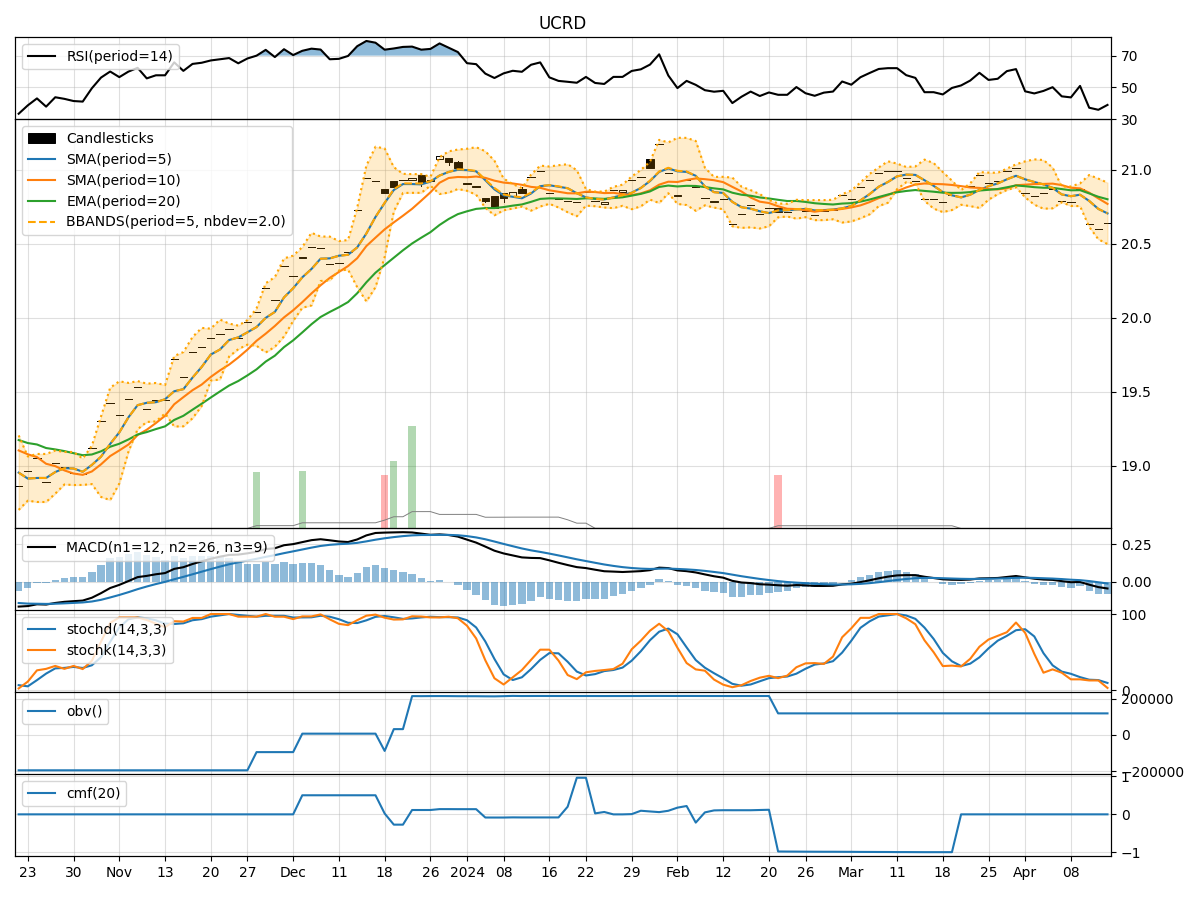
- Moving Averages (MA): The 5-day Moving Average (MA) has been consistently above the Simple Moving Average (SMA) and Exponential Moving Average (EMA), indicating a bullish trend.
- MACD: The MACD line has been consistently above the signal line, with both lines showing an upward trend, suggesting bullish momentum.
- RSI: The Relative Strength Index (RSI) has been fluctuating around the 50 level, indicating a neutral stance in terms of momentum.
Momentum Analysis:
- Stochastic Oscillator: The Stochastic Oscillator has been gradually decreasing but remains in the overbought territory, suggesting a potential reversal or consolidation.
- Williams %R: The Williams %R indicator has been in the oversold region, indicating a potential buying opportunity.
Volatility Analysis:
- Bollinger Bands (BB): The stock price has been trading within the Bollinger Bands, with the bands narrowing, indicating decreasing volatility.
- BB% (Bollinger Band %B): The %B indicator is hovering around the middle range, suggesting a balanced market sentiment.
Volume Analysis:
- On-Balance Volume (OBV): The OBV has been fluctuating around the zero line, indicating a balance between buying and selling pressure.
- Chaikin Money Flow (CMF): The CMF has been gradually increasing, indicating a potential inflow of money into the stock.
Key Observations:
- The trend indicators suggest a bullish sentiment, supported by the MACD and moving averages.
- Momentum indicators show a mixed signal, with the Stochastic Oscillator hinting at a potential reversal.
- Volatility is decreasing, as indicated by the narrowing Bollinger Bands.
- Volume indicators reflect a balanced market sentiment, with a slight increase in buying pressure.
Conclusion:
Based on the analysis of the technical indicators, the next few days for UCRD could see sideways consolidation with a slight upward bias. While the trend remains bullish, the momentum indicators suggest a possible reversal or consolidation in the short term. The decreasing volatility and balanced volume further support the view of a sideways movement. Investors should closely monitor the Stochastic Oscillator for potential reversal signals and consider the overall market conditions before making trading decisions.