Technical Analysis of UMDD 2024-05-10
Overview:
In analyzing the technical indicators for UMDD over the last 5 days, we will delve into the trend, momentum, volatility, and volume indicators to provide a comprehensive outlook on the possible stock price movement in the coming days. By examining key metrics such as moving averages, MACD, RSI, Bollinger Bands, and OBV, we aim to offer valuable insights and predictions for UMDD.
Trend Indicators:
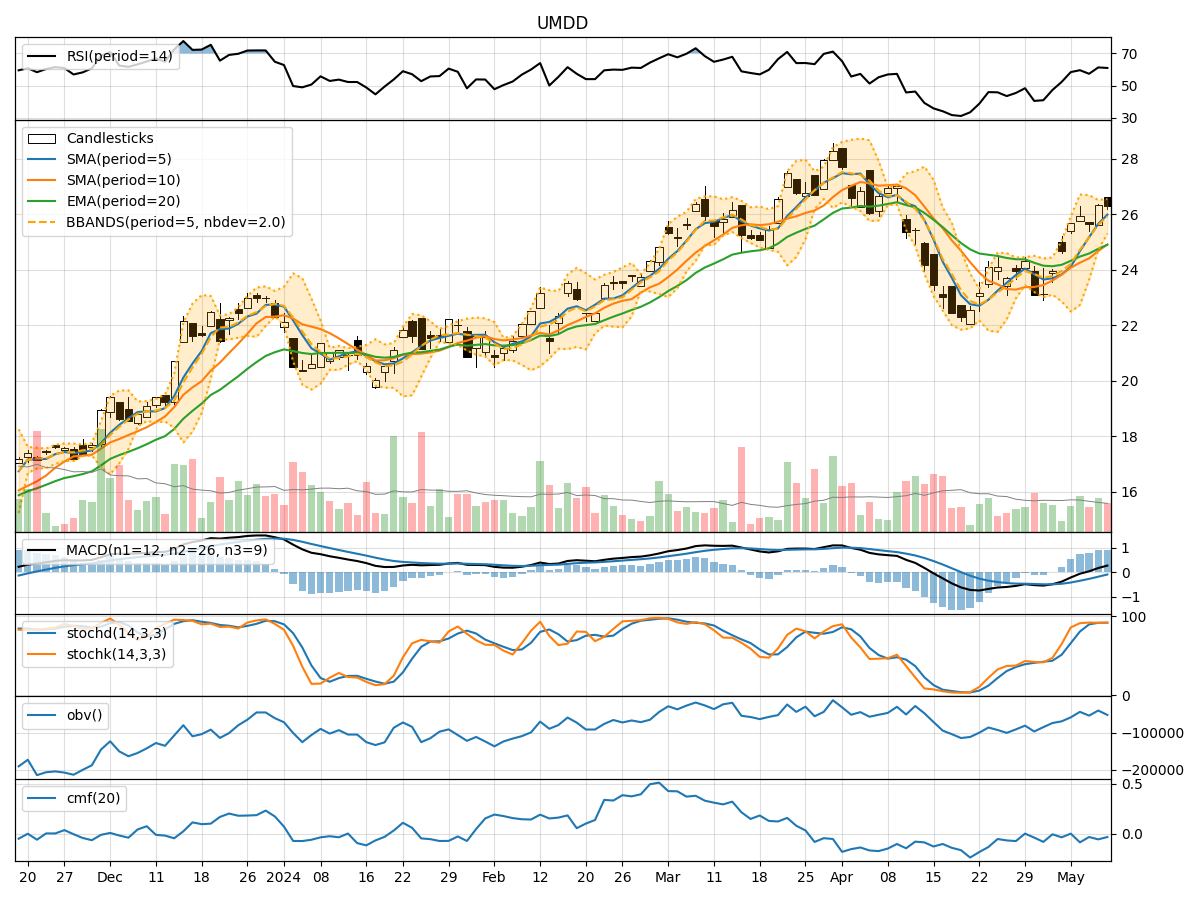
- Moving Averages (MA): The 5-day MA has been consistently above the closing prices, indicating a bullish trend.
- MACD: The MACD line has been above the signal line, suggesting a bullish momentum.
- MACD Histogram: The histogram has been increasing, indicating strengthening bullish momentum.
Momentum Indicators:
- RSI: The RSI has been in the neutral to slightly overbought territory, suggesting a balanced momentum.
- Stochastic Oscillator: Both %K and %D have been in the overbought zone, indicating a potential reversal.
- Williams %R: The indicator has been in the oversold region, signaling a possible buying opportunity.
Volatility Indicators:
- Bollinger Bands: The stock price has been trading within the bands, indicating normal volatility.
- Bollinger %B: The %B has been fluctuating around the midline, suggesting a balanced volatility.
Volume Indicators:
- On-Balance Volume (OBV): The OBV has been fluctuating, indicating mixed buying and selling pressure.
- Chaikin Money Flow (CMF): The CMF has been negative, suggesting outflow of money from the stock.
Key Observations:
- The trend indicators point towards a bullish sentiment with moving averages and MACD supporting upward momentum.
- Momentum indicators show a mixed picture with RSI in a neutral zone, stochastic oscillator signaling overbought conditions, and Williams %R indicating oversold levels.
- Volatility indicators suggest normal price fluctuations within the Bollinger Bands.
- Volume indicators reflect mixed sentiment with OBV fluctuating and CMF showing negative money flow.
Conclusion:
Based on the analysis of technical indicators, the stock price of UMDD is likely to experience further upward movement in the coming days. The bullish trend supported by moving averages and MACD, along with normal volatility within Bollinger Bands, indicates a positive outlook. However, caution is advised due to the overbought signals from the stochastic oscillator and the negative money flow indicated by CMF. Traders should monitor price action closely for potential profit-taking opportunities.