Technical Analysis of UNG 2024-05-10
Overview:
In analyzing the technical indicators for UNG over the last 5 days, we will delve into the trend, momentum, volatility, and volume indicators to provide a comprehensive outlook on the possible stock price movement in the coming days. By examining these key indicators, we aim to offer valuable insights and predictions to guide your investment decisions.
Trend Indicators:
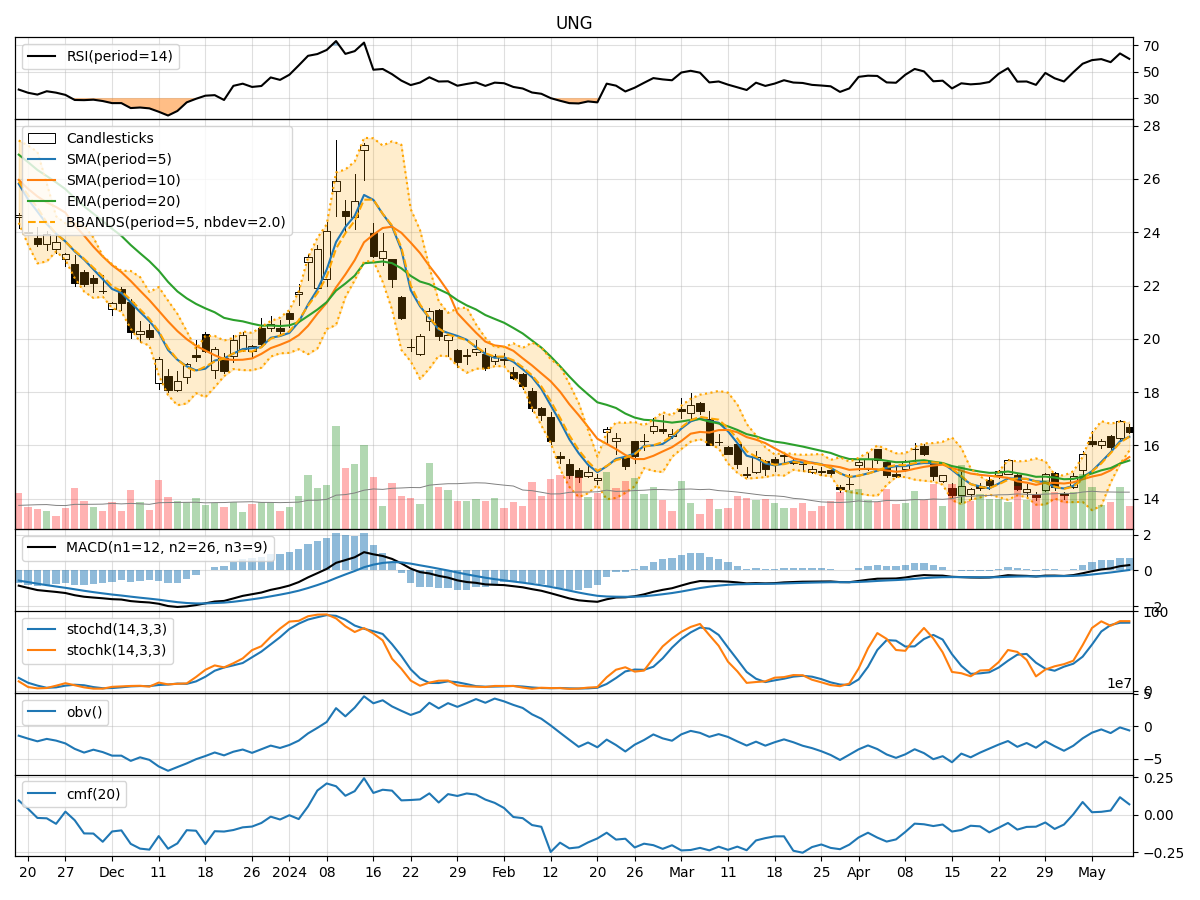
- Moving Averages (MA): The 5-day moving average has been consistently rising, indicating a bullish trend in the short term.
- MACD: The MACD line has been trending upwards, crossing above the signal line, suggesting a bullish momentum.
- EMA: The exponential moving average has also been on an upward trajectory, supporting the bullish sentiment.
Momentum Indicators:
- RSI: The Relative Strength Index has been fluctuating but generally staying within the neutral range, indicating a balanced momentum.
- Stochastic Oscillator: Both %K and %D have been relatively high, suggesting a bullish momentum.
- Williams %R: The indicator has been hovering around oversold levels, indicating a potential reversal in momentum.
Volatility Indicators:
- Bollinger Bands: The stock price has been trading within the bands, indicating moderate volatility.
- Bollinger %B: The %B indicator has been fluctuating but currently below 1, suggesting a potential buying opportunity.
- Average True Range (ATR): The ATR has shown moderate volatility levels, supporting stable price movements.
Volume Indicators:
- On-Balance Volume (OBV): The OBV has been fluctuating, indicating mixed buying and selling pressure.
- Chaikin Money Flow (CMF): The CMF has been positive, suggesting a net inflow of money into the stock.
Key Observations and Opinions:
- Trend: The trend indicators point towards a bullish sentiment in the short term.
- Momentum: Momentum indicators show a mixed picture with some bullish signals but also signs of potential reversal.
- Volatility: Volatility indicators suggest moderate price fluctuations with a potential buying opportunity.
- Volume: Volume indicators indicate mixed trading activity with a slight positive bias.
Conclusion:
Based on the analysis of the technical indicators, the next few days' possible stock price movement for UNG is likely to be bullish in the short term. The trend indicators support a positive outlook, while momentum indicators show a mixed but slightly bullish sentiment. Volatility is expected to remain moderate, providing opportunities for traders. However, it is essential to monitor the momentum indicators closely for any signs of a potential reversal in the bullish trend.