Technical Analysis of UNL 2024-05-10
Overview:
In analyzing the technical indicators for UNL over the last 5 days, we will delve into the trend, momentum, volatility, and volume indicators to provide a comprehensive outlook on the possible stock price movement in the coming days. By examining these key indicators, we aim to offer valuable insights and predictions for potential investors.
Trend Analysis:
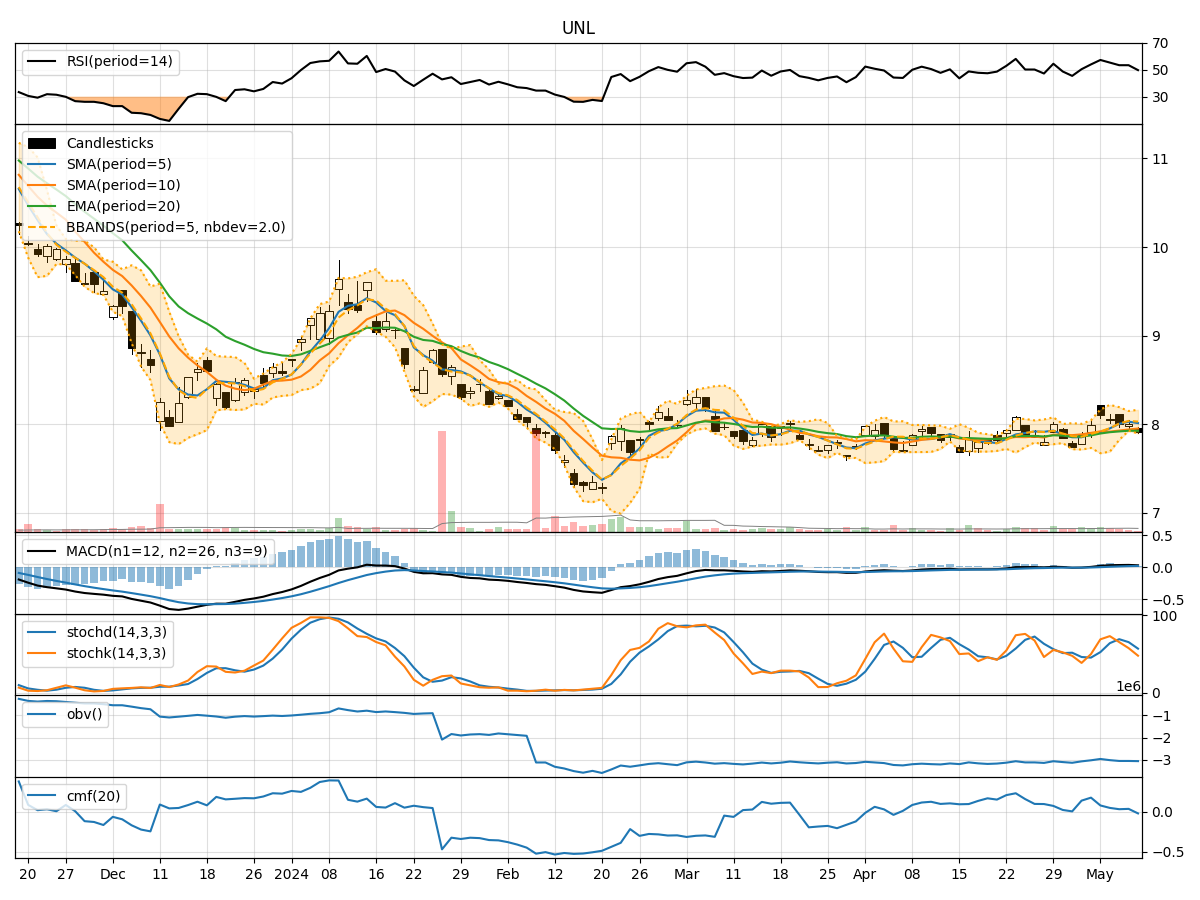
- Moving Averages (MA): The 5-day MA has been fluctuating around the closing prices, indicating short-term price trends. The stock has been trading close to the 5-day MA, suggesting a balanced price movement.
- MACD: The MACD line has been positive, indicating a bullish momentum in the stock price. The MACD histogram has been decreasing slightly, suggesting a potential slowdown in the bullish momentum.
Momentum Analysis:
- RSI: The RSI has been fluctuating around the 50 level, indicating a neutral momentum in the stock. There is no clear overbought or oversold signal based on the RSI.
- Stochastic Oscillator: The stochastic indicators have been showing mixed signals, with the %K line crossing below the %D line, indicating a potential bearish momentum shift.
Volatility Analysis:
- Bollinger Bands (BB): The stock price has been trading within the Bollinger Bands, with the bands narrowing in recent days. This suggests decreasing volatility and a potential consolidation phase in the stock price.
- Bollinger %B: The %B indicator has been hovering around 0.5, indicating a balanced price level within the bands.
Volume Analysis:
- On-Balance Volume (OBV): The OBV has been relatively stable, indicating a neutral volume flow in the stock. There is no significant divergence between price and volume movements.
- Chaikin Money Flow (CMF): The CMF has been positive but decreasing, suggesting a potential outflow of money from the stock in the short term.
Conclusion:
Based on the analysis of the technical indicators, the stock price of UNL is likely to experience sideways movement in the coming days. The trend indicators show a balanced price level with a slight bullish bias, while the momentum indicators signal a neutral to slightly bearish momentum. The volatility indicators point towards a potential consolidation phase, indicating a lack of significant price movements. The volume indicators suggest a neutral volume flow with a possible short-term outflow of money from the stock.
In conclusion, the overall outlook for UNL in the next few days is neutral to slightly bearish with a high probability of sideways consolidation. Investors should closely monitor key support and resistance levels for potential breakout or breakdown scenarios.