Technical Analysis of URTY 2024-05-10
Overview:
In analyzing the technical indicators for URTY over the last 5 days, we will delve into the trend, momentum, volatility, and volume indicators to provide a comprehensive outlook on the possible stock price movement in the coming days. By examining these key aspects, we aim to offer valuable insights and recommendations for informed decision-making.
Trend Indicators:
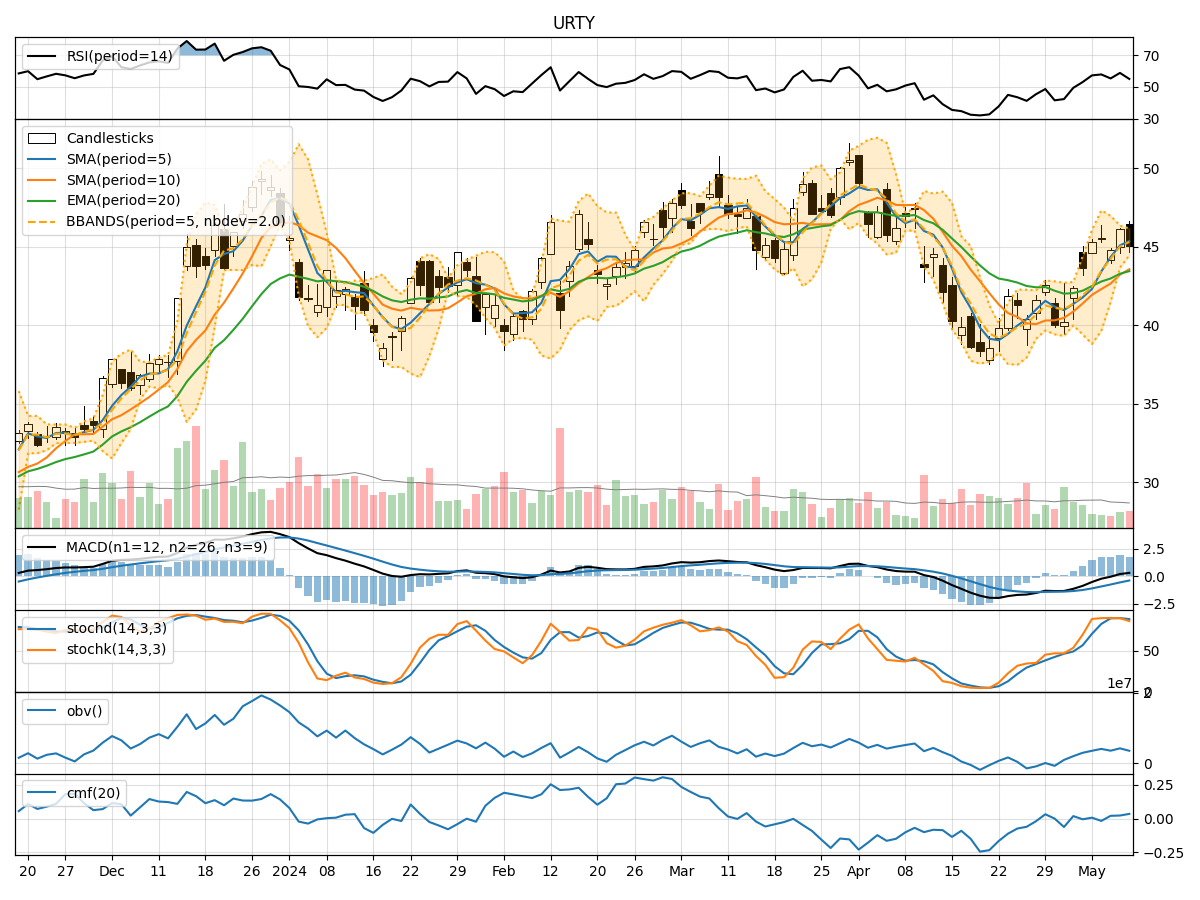
- Moving Averages (MA): The 5-day moving average has been consistently above the longer-term moving averages (SMA and EMA), indicating a short-term uptrend.
- MACD: The MACD line has been above the signal line for the past few days, suggesting bullish momentum.
- MACD Histogram: The MACD histogram has been increasing, indicating strengthening bullish momentum.
Momentum Indicators:
- RSI: The RSI has been fluctuating around the overbought territory, suggesting a strong bullish momentum.
- Stochastic Oscillator: Both %K and %D lines have been in the overbought zone, indicating a potential reversal or consolidation.
- Williams %R: The Williams %R has been in the oversold territory, signaling a potential buying opportunity.
Volatility Indicators:
- Bollinger Bands: The stock price has been trading within the upper Bollinger Band, indicating an overbought condition.
- Bollinger %B: The %B indicator is above 0.8, suggesting a potential reversal or pullback.
- Average True Range (ATR): The ATR has been relatively stable, indicating consistent volatility levels.
Volume Indicators:
- On-Balance Volume (OBV): The OBV has shown mixed signals, reflecting indecision among market participants.
- Chaikin Money Flow (CMF): The CMF has been positive, indicating buying pressure in the market.
Key Observations and Opinions:
- Trend: The trend indicators suggest a short-term uptrend in the stock price.
- Momentum: Momentum indicators indicate a strong bullish sentiment, but the overbought conditions may lead to a potential reversal or consolidation.
- Volatility: Volatility indicators point towards an overbought condition, potentially signaling a pullback or consolidation.
- Volume: Volume indicators show mixed signals, reflecting uncertainty in market participation.
Conclusion:
Based on the analysis of the technical indicators, the stock price of URTY is likely to experience a short-term consolidation or pullback in the coming days. The overbought conditions in momentum and volatility indicators suggest a potential reversal in the uptrend. Traders should exercise caution and consider taking profits or implementing risk management strategies in anticipation of a possible downward movement.