Technical Analysis of USCI 2024-05-10
Overview:
In analyzing the technical indicators for USCI over the last 5 days, we will delve into the trend, momentum, volatility, and volume indicators to provide a comprehensive outlook on the possible stock price movement in the coming days. By examining these key aspects, we aim to offer valuable insights and predictions for informed decision-making.
Trend Analysis:
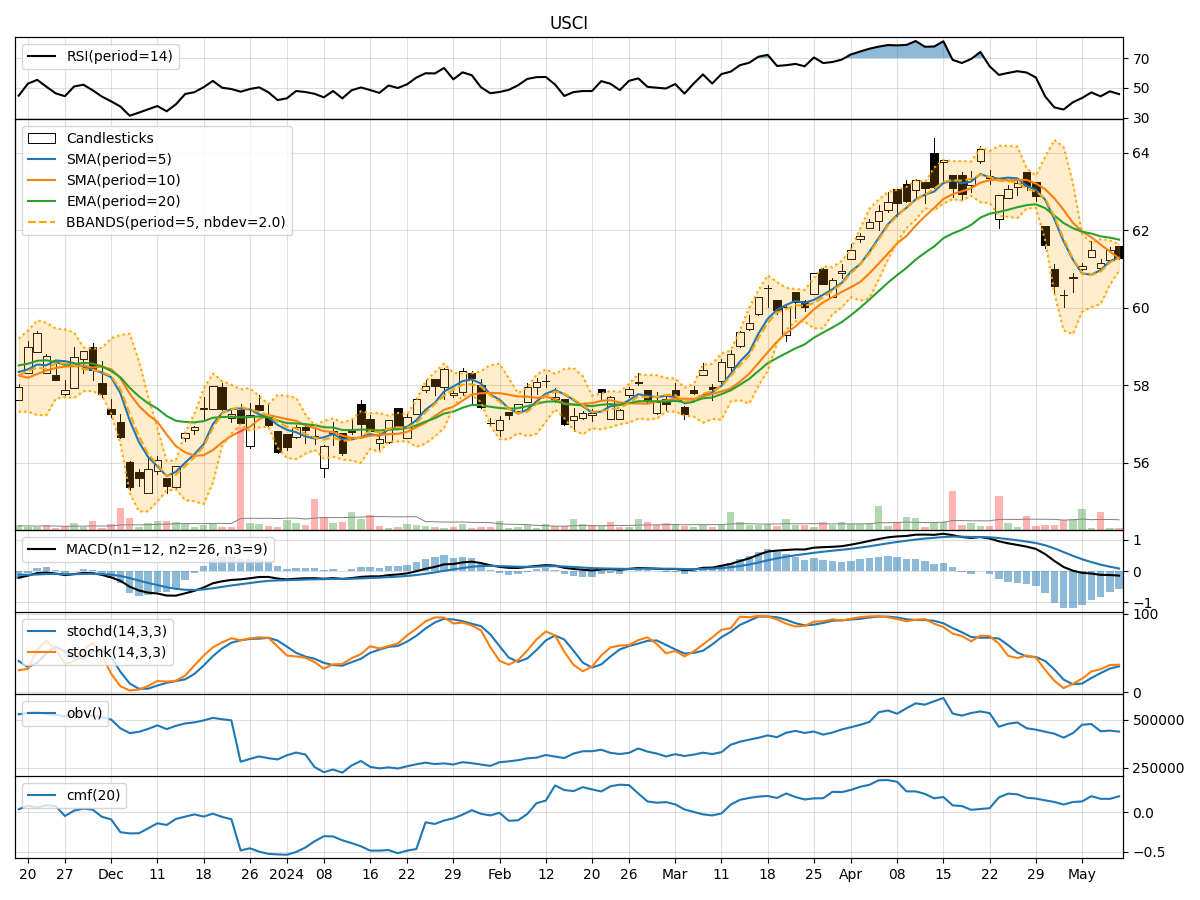
- Moving Averages (MA): The 5-day MA has been fluctuating around the closing prices, indicating short-term price trends. The SMA(10) and EMA(20) have been gradually declining, suggesting a bearish sentiment.
- MACD: The MACD line has been consistently negative, with the MACD histogram showing a decreasing trend, indicating a bearish momentum.
- Conclusion: The trend indicators point towards a bearish outlook for USCI in the near term.
Momentum Analysis:
- RSI: The RSI has been hovering around the mid-range, indicating a neutral momentum.
- Stochastic Oscillator: Both %K and %D have been fluctuating in the overbought territory, suggesting a potential reversal.
- Williams %R: The indicator has been oscillating in the oversold region, signaling a possible buying opportunity.
- Conclusion: The momentum indicators suggest a neutral to slightly bearish momentum for USCI.
Volatility Analysis:
- Bollinger Bands: The price has been trading within the bands, with the bands narrowing, indicating decreasing volatility.
- Conclusion: Volatility is decreasing, which could lead to a period of consolidation or a potential breakout in the near future.
Volume Analysis:
- On-Balance Volume (OBV): The OBV has been relatively stable, indicating a balance between buying and selling pressure.
- Chaikin Money Flow (CMF): The CMF has been positive, suggesting a bullish money flow.
- Conclusion: Volume indicators show a neutral sentiment with a slight bullish bias.
Overall Conclusion:
Based on the analysis of trend, momentum, volatility, and volume indicators, the next few days for USCI are likely to see a bearish trend continuation with neutral to slightly bearish momentum. The decreasing volatility may lead to a period of consolidation before a potential breakout. The volume indicators suggest a balanced outlook with a slight bullish bias. Traders should exercise caution and consider waiting for clearer signals before making significant trading decisions.
Key Takeaways:
- Trend: Bearish
- Momentum: Neutral to Slightly Bearish
- Volatility: Decreasing, Potential Consolidation
- Volume: Neutral with Slight Bullish Bias
Recommendation:
Given the overall outlook, it is advisable to monitor the price action closely for any signs of a trend reversal or confirmation. Traders may consider waiting for a clearer direction before entering new positions. Risk management strategies should be implemented to mitigate potential losses in a volatile market environment.