Technical Analysis of USFR 2024-05-10
Overview:
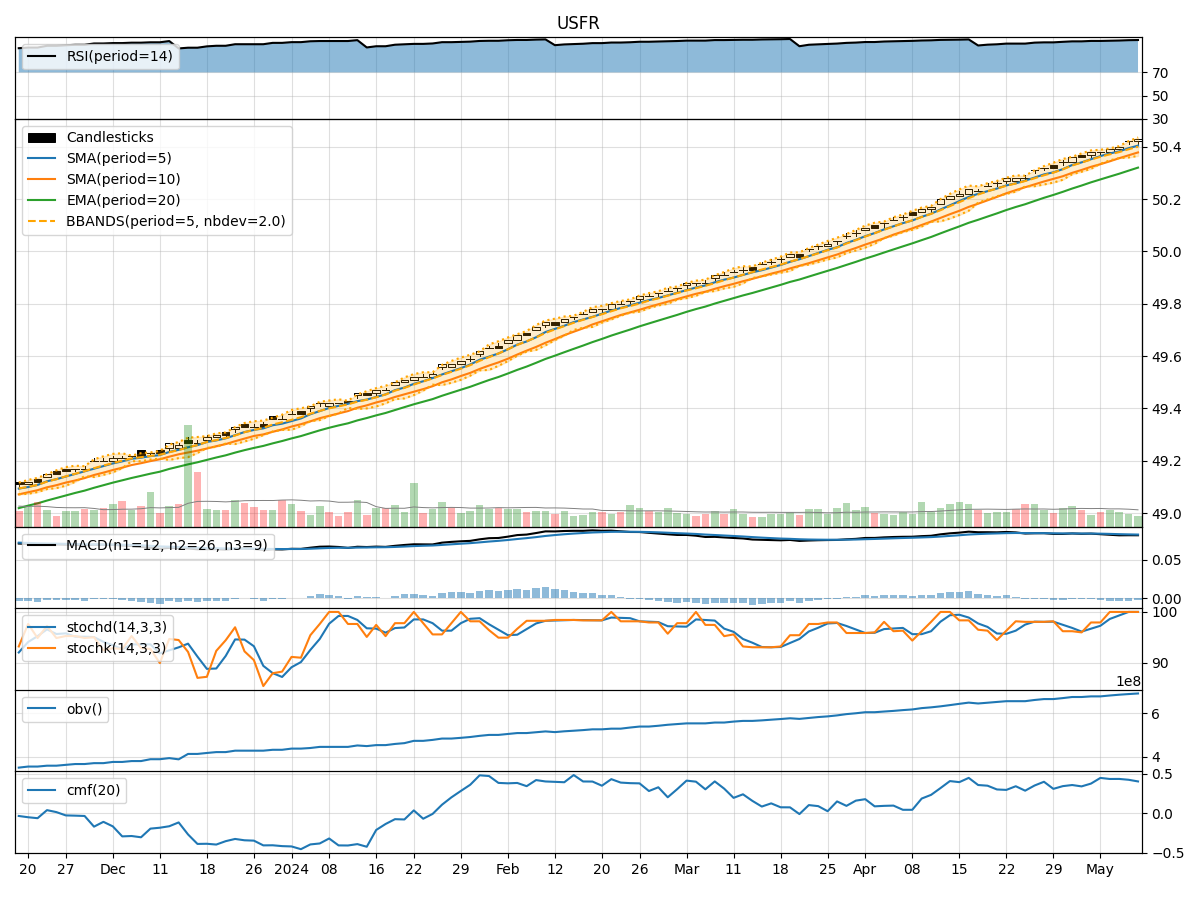
In analyzing the technical indicators for USFR over the last 5 days, we will delve into the trend, momentum, volatility, and volume indicators to provide a comprehensive outlook on the possible stock price movement in the coming days.
Trend Indicators:
- Moving Averages (MA): The 5-day MA has been consistently above the closing price, indicating a short-term uptrend.
- MACD: The MACD line has been positive, suggesting bullish momentum.
- MACD Histogram: The MACD Histogram has been decreasing but remains above the zero line, indicating a potential slowdown in momentum.
Momentum Indicators:
- RSI: The RSI has been in the overbought territory, signaling a strong bullish momentum.
- Stochastic Oscillator: Both %K and %D have been at 100, indicating an extremely overbought condition.
- Williams %R: The Williams %R has been at 0, reflecting a strong bullish sentiment.
Volatility Indicators:
- Bollinger Bands (BB): The stock price has been consistently trading above the upper Bollinger Band, suggesting overbought conditions.
- Bollinger Band Width: The Band Width has been expanding, indicating increased volatility.
- Bollinger Band %B: The %B has been above 0.8, indicating an overbought condition.
Volume Indicators:
- On-Balance Volume (OBV): The OBV has been steadily increasing, reflecting strong buying pressure.
- Chaikin Money Flow (CMF): The CMF has been positive, indicating money flow into the stock.
Key Observations and Opinions:
- Trend: The trend indicators suggest a short-term uptrend in the stock price.
- Momentum: The momentum indicators indicate an extremely overbought condition, signaling a potential reversal or consolidation.
- Volatility: The volatility indicators point towards increased volatility and an overbought market.
- Volume: The volume indicators show strong buying pressure and positive money flow into the stock.
Conclusion:
Based on the analysis of the technical indicators, the stock price of USFR is overbought and experiencing strong bullish momentum. However, the extreme overbought conditions and potential slowdown in momentum indicated by the MACD Histogram suggest a possible consolidation or correction in the coming days. Traders should exercise caution and consider taking profits or implementing risk management strategies in anticipation of a potential pullback.