Technical Analysis of UST 2024-05-10
Overview:
In analyzing the technical indicators for UST stock over the last 5 days, we will delve into the trends, momentum, volatility, and volume aspects to provide a comprehensive outlook on the possible stock price movement in the upcoming days. By examining key indicators such as moving averages, MACD, RSI, Bollinger Bands, and OBV, we aim to offer valuable insights and predictions for informed decision-making.
Trend Analysis:
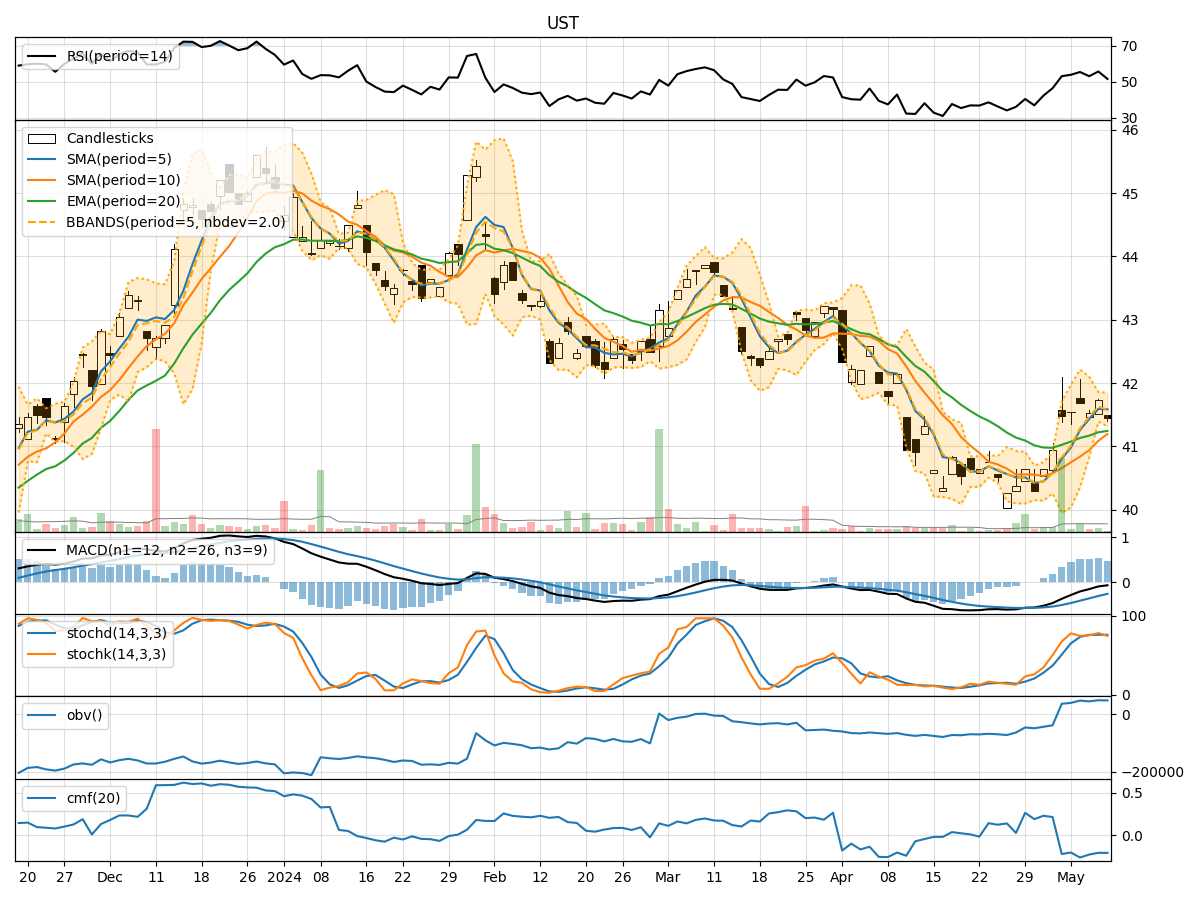
- Moving Averages (MA): The 5-day MA has been consistently above the closing prices, indicating a short-term uptrend.
- MACD: The MACD line has been negative but converging towards the signal line, suggesting a potential reversal in the downtrend.
Key Observation: The short-term trend is showing signs of potential reversal to the upside.
Momentum Analysis:
- RSI: The RSI values have been fluctuating around the neutral 50 level, indicating indecision in the market.
- Stochastic Oscillator: Both %K and %D have been hovering in the overbought territory, signaling a potential pullback.
Key Observation: Momentum is currently neutral with a slight bearish bias.
Volatility Analysis:
- Bollinger Bands (BB): The stock price has been trading within the bands, with the bands narrowing, suggesting reduced volatility.
Key Observation: Volatility is decreasing, indicating a possible period of consolidation.
Volume Analysis:
- On-Balance Volume (OBV): The OBV has been relatively flat, indicating a balance between buying and selling pressure.
- Chaikin Money Flow (CMF): The CMF has been negative, reflecting outflow of money from the stock.
Key Observation: Volume indicators suggest a lack of strong buying or selling pressure.
Conclusion:
Based on the analysis of the technical indicators, the next few days for UST stock are likely to see sideways movement with a slight upward bias. The trend indicators hint at a potential reversal to the upside, while momentum remains neutral with a bearish tilt. Volatility is decreasing, pointing towards a period of consolidation, and volume indicators indicate a balance between buyers and sellers.
Key Conclusion: Expect UST stock to trade sideways with a slight upward bias in the near term.