Technical Analysis of VBND 2024-05-10
Overview:
In analyzing the technical indicators for VBND over the last 5 days, we will delve into the trend, momentum, volatility, and volume indicators to provide a comprehensive outlook on the possible stock price movement in the coming days. By examining these key aspects, we aim to offer valuable insights and predictions for potential investors.
Trend Indicators:
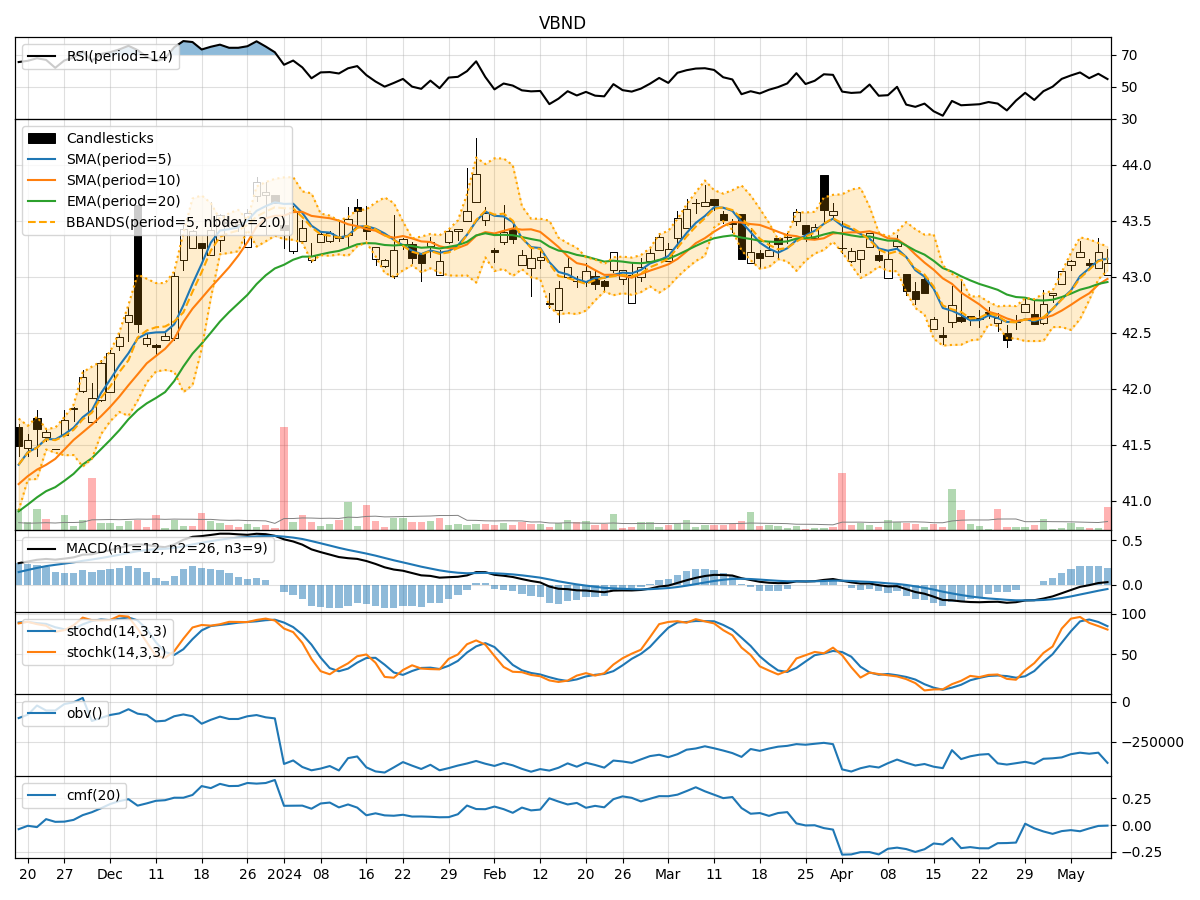
- Moving Averages (MA): The 5-day MA has been consistently above the closing prices, indicating a short-term uptrend.
- MACD: The MACD line has been positive, suggesting bullish momentum.
- RSI: The RSI values have been fluctuating around the overbought territory, indicating potential strength in the uptrend.
Momentum Indicators:
- Stochastic Oscillator: The stochastic indicators have been in the overbought region, signaling a potential reversal or consolidation.
- Williams %R: The Williams %R values have been fluctuating, indicating potential reversal points.
Volatility Indicators:
- Bollinger Bands (BB): The price has been mostly within the bands, suggesting a period of consolidation.
- BB Width: The width of the bands has been narrowing, indicating decreasing volatility.
Volume Indicators:
- On-Balance Volume (OBV): The OBV has been fluctuating, suggesting mixed sentiment among investors.
- Chaikin Money Flow (CMF): The CMF has been negative, indicating potential selling pressure.
Key Observations:
- The trend indicators suggest a short-term uptrend, supported by positive MACD and RSI values.
- Momentum indicators show signs of potential reversal or consolidation due to overbought conditions.
- Volatility indicators point towards a period of consolidation with decreasing volatility.
- Volume indicators reflect mixed sentiment among investors, with a negative CMF indicating selling pressure.
Conclusion:
Based on the analysis of the technical indicators, the next few days for VBND could see sideways movement or a slight pullback as the stock may consolidate after the recent uptrend. Investors should closely monitor key support and resistance levels for potential entry or exit points. Exercise caution in trading during this period of potential consolidation to avoid unnecessary risks.