Technical Analysis of VBR 2024-05-31
Overview:
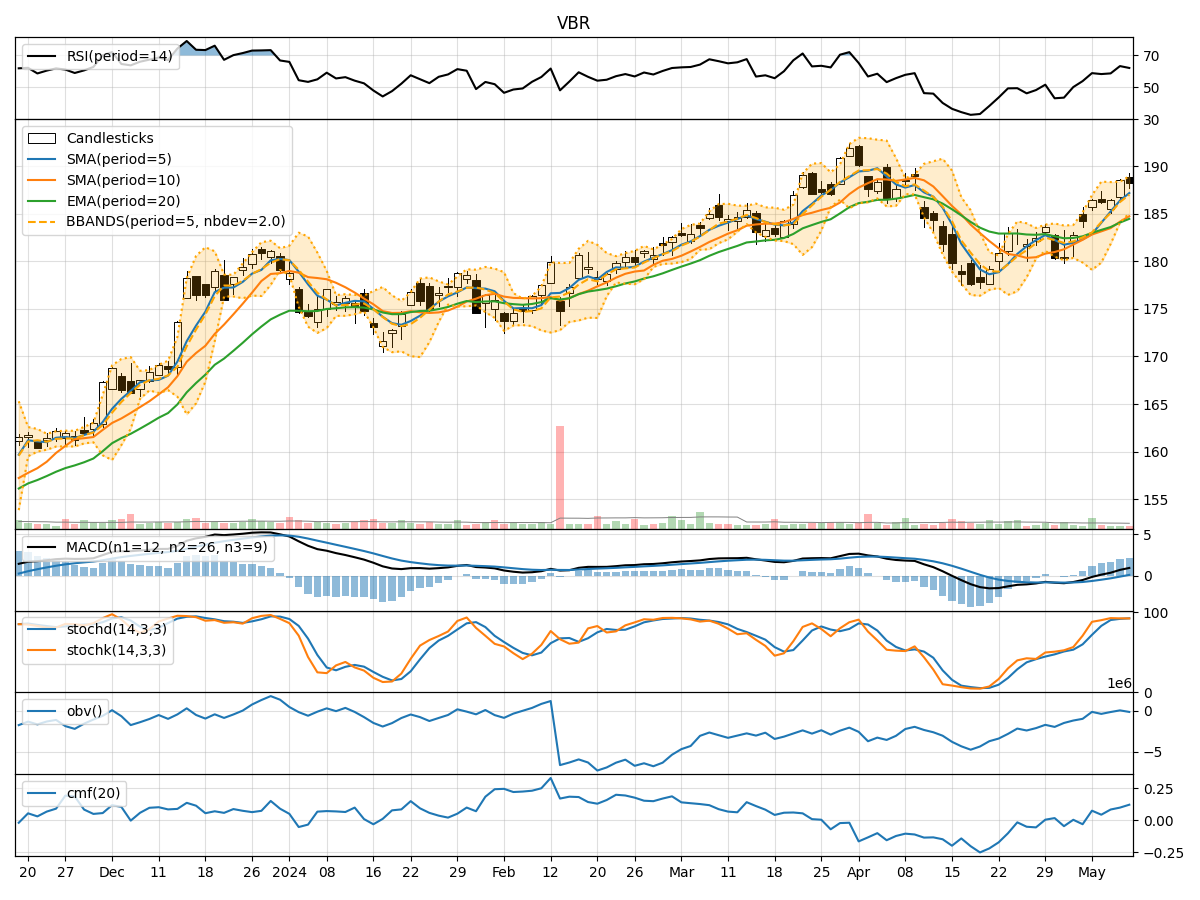
In analyzing the technical indicators for VBR over the last 5 days, we will delve into the trend, momentum, volatility, and volume indicators to provide a comprehensive outlook on the possible stock price movement in the coming days. By examining these key aspects, we aim to offer valuable insights and predictions for informed decision-making.
Trend Analysis:
- Moving Averages (MA): The 5-day MA has been consistently below the closing prices, indicating a short-term downtrend.
- MACD: The MACD line has been below the signal line, suggesting bearish momentum.
- RSI: The RSI values have been fluctuating around the 50 level, reflecting indecision in the market.
Momentum Analysis:
- Stochastic Oscillator: Both %K and %D have been in oversold territory, signaling a potential reversal.
- Williams %R: The indicator has been deeply oversold, indicating a possible buying opportunity.
Volatility Analysis:
- Bollinger Bands (BB): The stock price has been trading within the bands, suggesting a period of consolidation.
- BB Width: The bands have been narrowing, indicating decreasing volatility.
Volume Analysis:
- On-Balance Volume (OBV): The OBV has been declining, indicating selling pressure.
- Chaikin Money Flow (CMF): The CMF has been negative, suggesting outflow of money from the stock.
Key Observations:
- The stock is currently in a downtrend based on moving averages and MACD.
- Momentum indicators show oversold conditions, potentially signaling a reversal.
- Volatility is contracting, indicating a period of consolidation.
- Volume indicators suggest selling pressure and negative money flow.
Conclusion:
Based on the analysis of the technical indicators, the next few days' possible stock price movement for VBR is likely to be sideways to slightly bullish. While the trend and volume indicators point towards a bearish bias, the oversold momentum indicators and contracting volatility suggest a potential reversal or consolidation in the near term. Traders should closely monitor key support and resistance levels for confirmation of a trend reversal or continuation.