Technical Analysis of VEMY 2024-05-10
Overview:
In analyzing the technical indicators for VEMY over the last 5 days, we will delve into the trend, momentum, volatility, and volume indicators to provide a comprehensive outlook on the possible stock price movement in the coming days. By examining these key aspects, we aim to offer valuable insights and predictions for potential investors.
Trend Indicators:
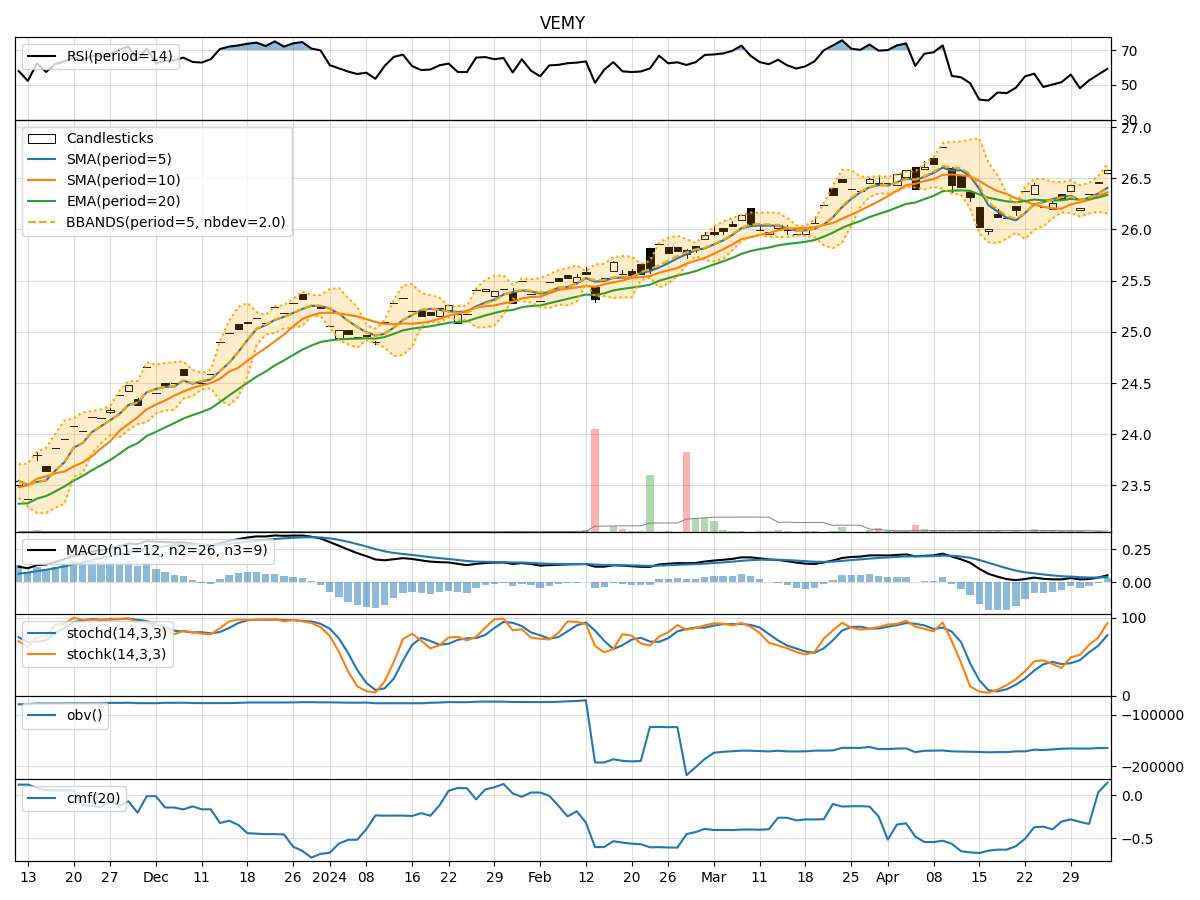
- Moving Averages (MA): The 5-day MA has been consistently above the closing prices, indicating a short-term uptrend.
- MACD: The MACD line has been above the signal line, suggesting bullish momentum.
- EMA: The EMA has been trending upwards, supporting the bullish sentiment.
Key Observation: The trend indicators point towards an upward trend in the stock price.
Momentum Indicators:
- RSI: The RSI has been fluctuating around the 60 level, indicating moderate momentum.
- Stochastic Oscillator: Both %K and %D have been hovering in the overbought territory, signaling potential overextension.
- Williams %R: The indicator has been oscillating near oversold levels, suggesting a possible reversal.
Key Observation: Momentum indicators suggest a mixed outlook with a slight bias towards a bearish reversal.
Volatility Indicators:
- Bollinger Bands: The stock price has been trading within the bands, indicating normal volatility.
- Bollinger %B: The %B indicator has been fluctuating around the midline, reflecting balanced volatility.
Key Observation: Volatility indicators suggest a stable price movement with no significant deviations.
Volume Indicators:
- On-Balance Volume (OBV): The OBV has shown a slight decline, indicating some distribution.
- Chaikin Money Flow (CMF): The CMF has been positive, suggesting buying pressure.
Key Observation: Volume indicators hint at mixed sentiment with a slight inclination towards selling pressure.
Conclusion:
Based on the analysis of the technical indicators, the next few days' possible stock price movement for VEMY is likely to be sideways with a slight bearish bias. While the trend indicators support an upward trajectory, the momentum indicators signal a potential reversal. Volatility remains stable, but volume indicators hint at some distribution. Therefore, investors should exercise caution and consider potential downside risks in the short term.
Recommendation:
- Short-term Traders: Consider taking profits or implementing hedging strategies due to the mixed signals.
- Long-term Investors: Monitor the price action closely and wait for more clarity before making significant decisions.
Always remember to conduct thorough research and consider multiple factors before making investment decisions.