Technical Analysis of VIXY 2024-05-10
Overview:
In analyzing the technical indicators for VIXY over the last 5 days, we will delve into the trend, momentum, volatility, and volume indicators to provide a comprehensive outlook on the possible stock price movement in the coming days. By examining these key aspects, we aim to offer valuable insights and recommendations for potential investors.
Trend Analysis:
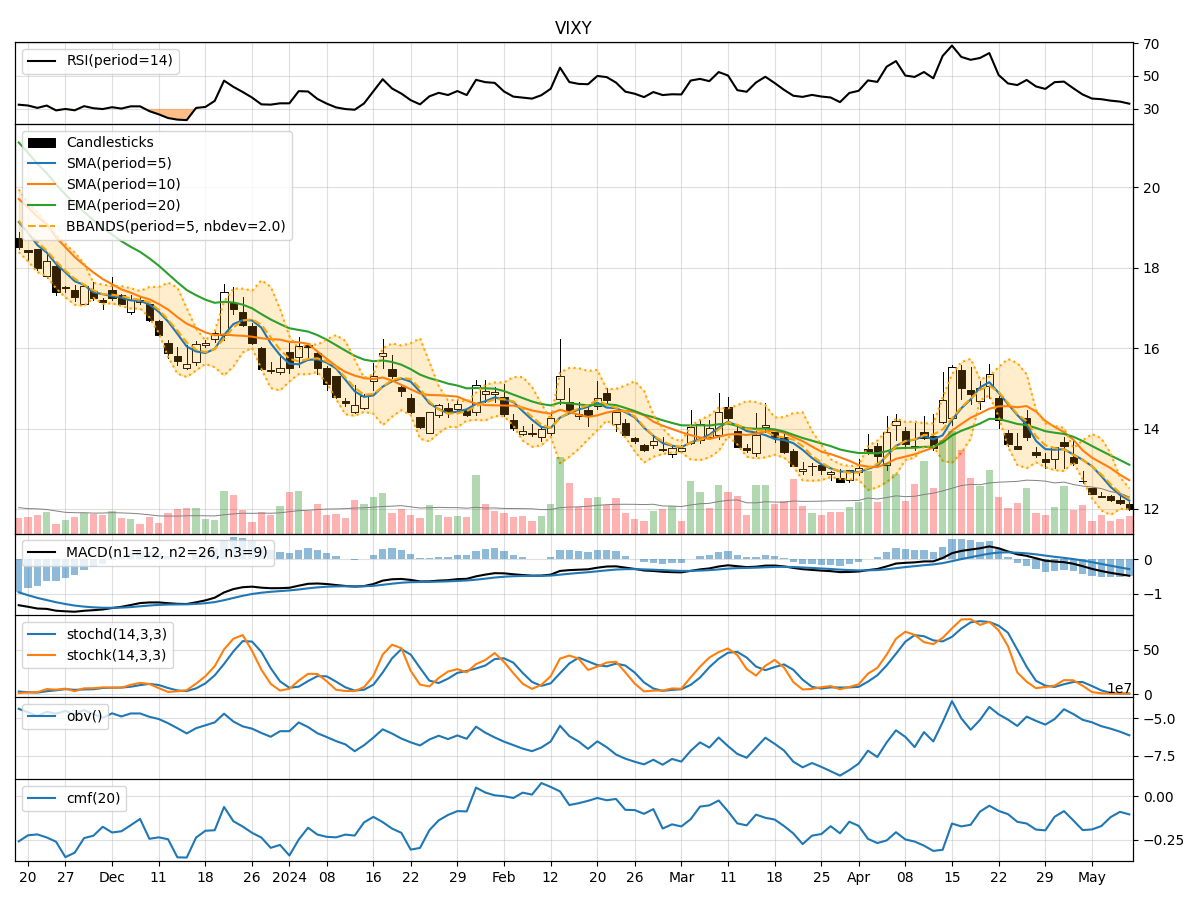
- Moving Averages (MA): The 5-day MA has been consistently below the longer-term SMAs and EMAs, indicating a downward trend in the stock price.
- MACD: The MACD line has been decreasing, with the MACD line consistently below the signal line, suggesting bearish momentum.
- RSI: The RSI has been declining and is currently below 50, indicating a weakening trend.
Key Observation: The trend indicators point towards a downward trajectory for VIXY.
Momentum Analysis:
- Stochastic Oscillator: Both %K and %D have been decreasing, signaling a loss in momentum.
- Williams %R: The indicator has been in oversold territory, suggesting a potential reversal or continuation of the downtrend.
Key Observation: Momentum indicators reflect a bearish sentiment for VIXY.
Volatility Analysis:
- Bollinger Bands: The stock price has been consistently below the lower Bollinger Band, indicating oversold conditions.
- Volatility Percentage: The volatility percentage has been relatively low, suggesting a lack of significant price movements.
Key Observation: Volatility indicators imply a sideways or consolidation phase for VIXY.
Volume Analysis:
- On-Balance Volume (OBV): The OBV has been declining, indicating selling pressure in the stock.
- Chaikin Money Flow (CMF): The CMF has been negative, reflecting a lack of buying interest.
Key Observation: Volume indicators support a bearish outlook for VIXY.
Conclusion:
Based on the analysis of trend, momentum, volatility, and volume indicators, the overall outlook for VIXY suggests a continued downward movement in the stock price in the coming days. The technical indicators align in signaling a bearish trend, with momentum and volume supporting the downside potential. Traders and investors should exercise caution and consider short-term strategies aligned with the prevailing bearish sentiment in VIXY.
Key Conclusion:
The technical analysis indicates a bearish outlook for VIXY, with a high probability of further downside movement in the stock price. Investors should closely monitor the evolving market dynamics and adjust their strategies accordingly to mitigate risks associated with the current market conditions.