Technical Analysis of VO 2024-05-10
Overview:
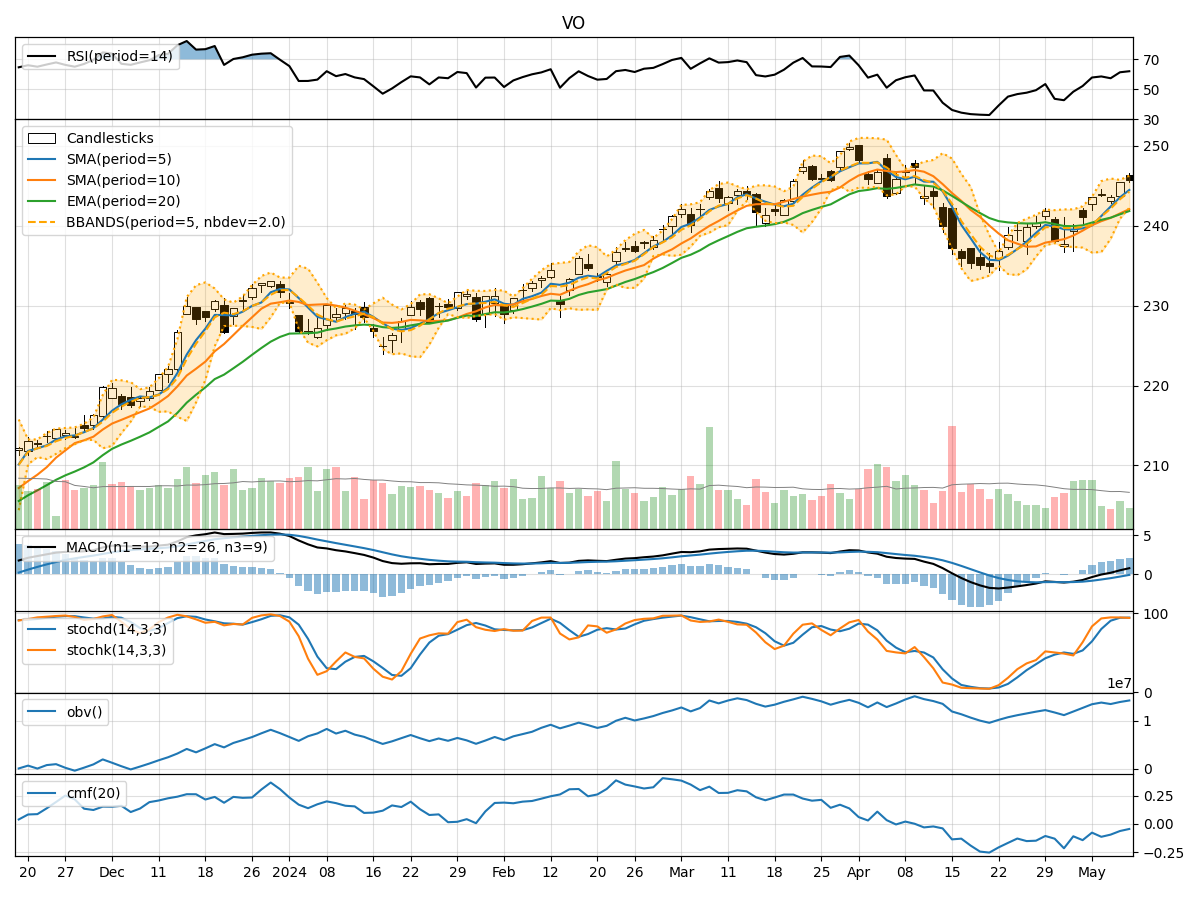
In the last 5 trading days, the stock price of VO has shown a slight upward trend with increasing volume. The trend indicators suggest a positive momentum, supported by the moving averages and MACD. The momentum indicators indicate a strengthening bullish sentiment, with RSI and Stochastic oscillators in overbought territory. Volatility indicators show a narrowing Bollinger Band, indicating potential price consolidation. Volume indicators suggest a slight increase in buying pressure.
Trend Indicators Analysis:
- Moving Averages (MA): The 5-day MA is consistently above the longer-term SMAs, indicating a short-term bullish trend.
- MACD: The MACD line is above the signal line, indicating a bullish momentum.
- MACD Histogram: The histogram is positive and increasing, supporting the bullish momentum.
Momentum Indicators Analysis:
- RSI: The RSI is in the overbought zone, suggesting a strong bullish momentum.
- Stochastic Oscillator: Both %K and %D are in the overbought region, indicating a strong buying pressure.
- Williams %R: The indicator is in the oversold region, suggesting a potential reversal.
Volatility Indicators Analysis:
- Bollinger Bands (BB): The bands are narrowing, indicating decreasing volatility and a potential price consolidation phase.
- Bollinger Band %B: The %B is close to 1, suggesting the price is near the upper band.
Volume Indicators Analysis:
- On-Balance Volume (OBV): The OBV is showing a slight increase, indicating higher buying volume.
- Chaikin Money Flow (CMF): The CMF is negative, suggesting some selling pressure.
Key Observations:
- The stock is in a short-term bullish trend supported by moving averages and MACD.
- Momentum indicators show a strong bullish sentiment with overbought conditions.
- Volatility is decreasing, indicating a potential consolidation phase.
- Volume is slightly increasing, supporting the bullish bias.
Conclusion:
Based on the technical analysis of trend, momentum, volatility, and volume indicators, the next few days' possible stock price movement for VO is likely to continue in an upward direction. The bullish momentum is strong, supported by the trend indicators and positive volume flow. However, considering the overbought conditions in momentum indicators and narrowing volatility, we may see a temporary consolidation or a minor pullback before the uptrend resumes. Traders should watch for potential reversal signals in momentum indicators and monitor volume for confirmation of the bullish bias. Overall, the outlook for VO remains bullish in the near term.