Technical Analysis of VPLS 2024-05-10
Overview:
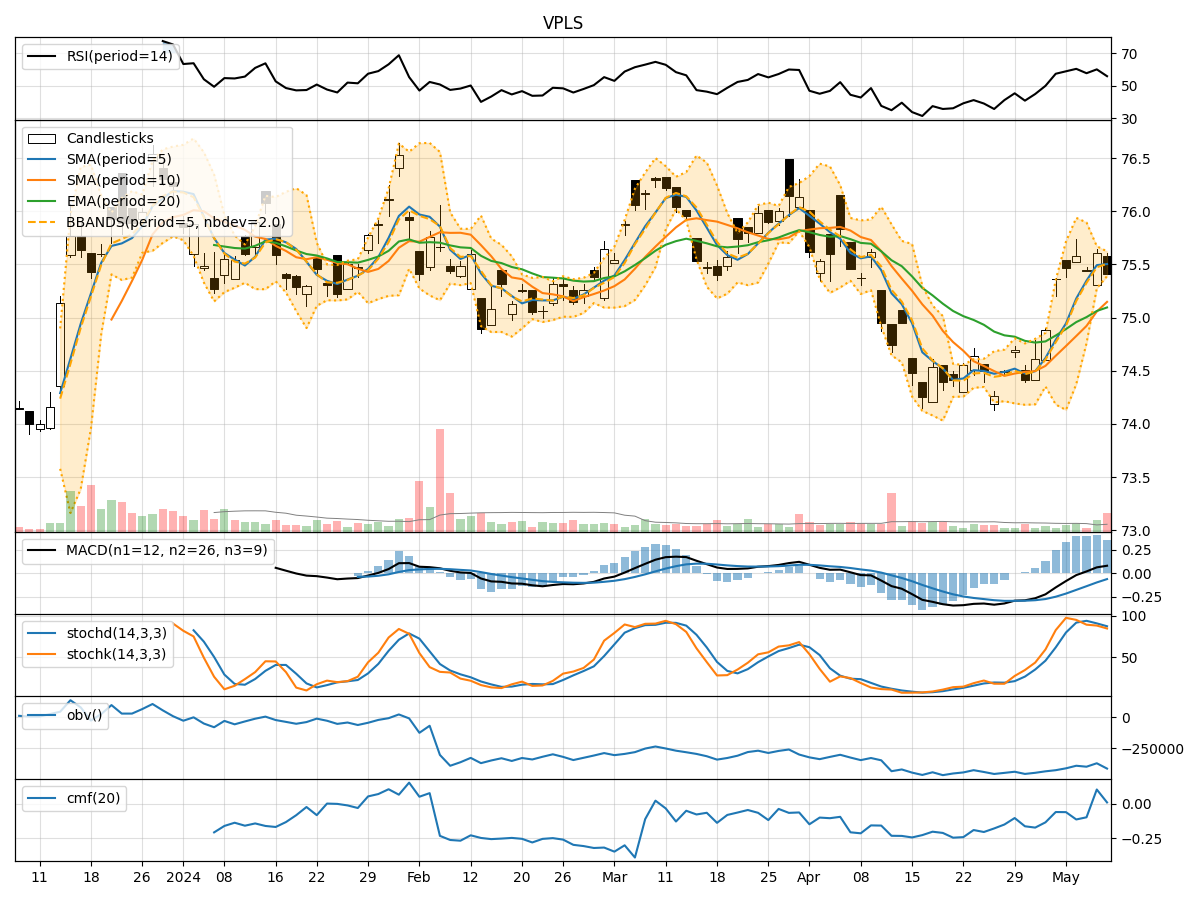
In analyzing the technical indicators for VPLS over the last 5 days, we will delve into the trend, momentum, volatility, and volume indicators to provide a comprehensive outlook on the possible stock price movement in the coming days. By examining these key indicators, we aim to offer valuable insights and predictions for potential investors.
Trend Indicators:
- Moving Averages (MA): The 5-day moving average has been consistently above the simple moving average (SMA) and exponential moving average (EMA), indicating a bullish trend.
- MACD: The MACD line has been consistently above the signal line, suggesting a bullish momentum in the stock price.
- MACD Histogram: The MACD histogram has been mostly positive, further supporting the bullish sentiment.
Momentum Indicators:
- RSI: The Relative Strength Index (RSI) has been fluctuating around the 50 level, indicating a neutral momentum in the stock.
- Stochastic Oscillator: Both %K and %D have been trending downwards, suggesting a potential bearish momentum.
- Williams %R: The Williams %R is in the oversold territory, indicating a possible reversal in the stock price.
Volatility Indicators:
- Bollinger Bands: The stock price has been trading within the Bollinger Bands, with the bands narrowing, indicating decreasing volatility.
- Bollinger %B: The %B indicator is hovering around the middle range, suggesting a neutral stance in terms of volatility.
Volume Indicators:
- On-Balance Volume (OBV): The OBV has been fluctuating, indicating mixed buying and selling pressure.
- Chaikin Money Flow (CMF): The CMF has been negative, suggesting a bearish sentiment in terms of volume flow.
Conclusion:
Based on the analysis of the technical indicators, the stock of VPLS is currently exhibiting a mixed outlook. While the trend indicators point towards a bullish bias with moving averages and MACD signaling positive momentum, the momentum indicators like RSI and Stochastic Oscillator suggest a neutral to bearish sentiment. Volatility indicators indicate decreasing volatility, which could lead to a period of consolidation.
Considering the overall picture, it is crucial to monitor the stock closely in the coming days for any potential shifts in momentum and volume. Investors should exercise caution and wait for clearer signals before making any significant trading decisions.