Technical Analysis of VTC 2024-05-10
Overview:
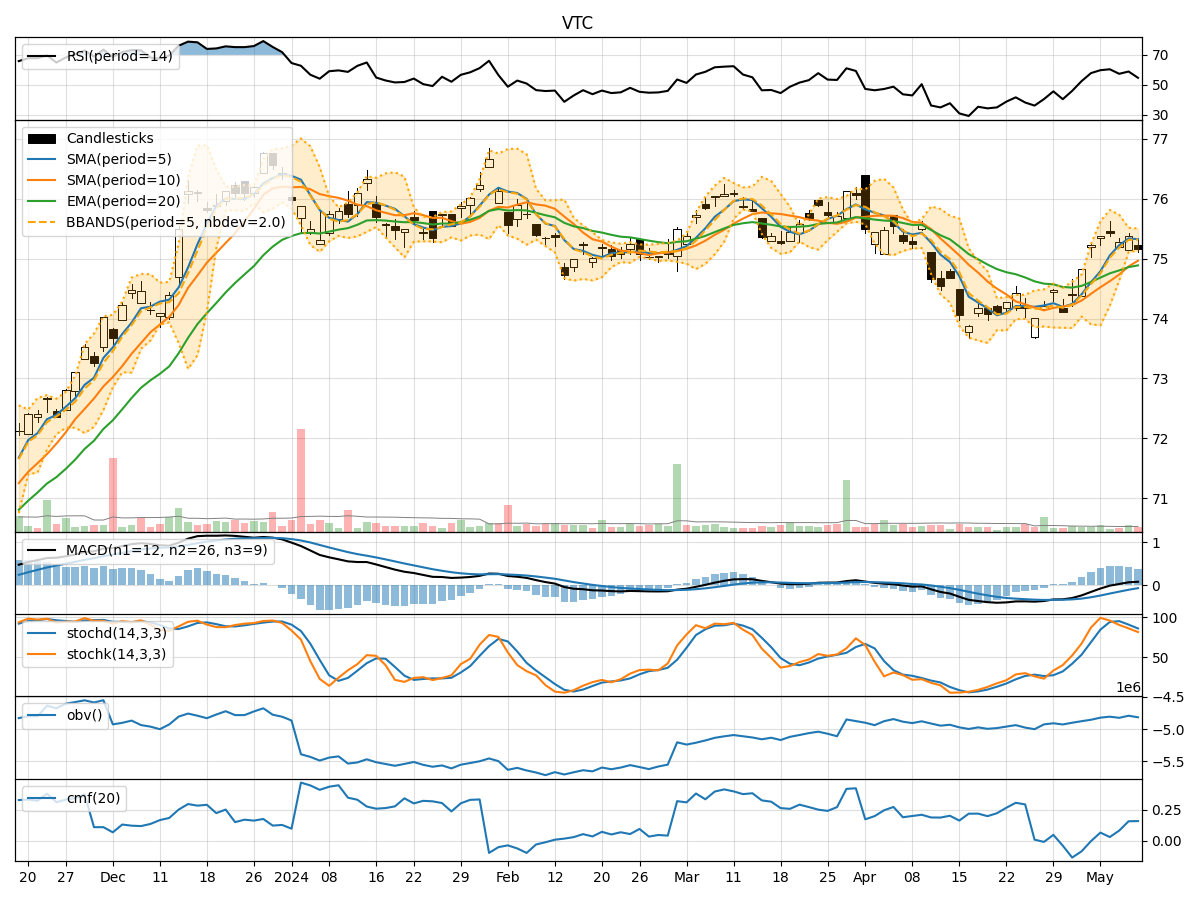
In analyzing the technical indicators for VTC over the last 5 days, we will delve into the trend, momentum, volatility, and volume indicators to provide a comprehensive outlook on the possible stock price movement in the coming days. By examining these key aspects, we aim to offer valuable insights and predictions for potential investors.
Trend Indicators:
- Moving Averages (MA): The 5-day MA has been consistently above the 10-day SMA, indicating a short-term bullish trend. The EMA(20) has shown a slight upward trajectory, suggesting a positive momentum.
- MACD: The MACD line has been above the signal line for the past few days, indicating a bullish trend. The MACD histogram has been gradually increasing, reflecting strengthening bullish momentum.
Momentum Indicators:
- RSI: The RSI has been fluctuating around the 50 level, indicating a neutral momentum in the stock. There is no clear overbought or oversold signal.
- Stochastic Oscillator: Both %K and %D lines of the Stochastic Oscillator have been trending downwards, suggesting a potential bearish momentum in the stock.
Volatility Indicators:
- Bollinger Bands (BB): The stock price has been trading within the Bollinger Bands, with the bands narrowing slightly. This could indicate a period of consolidation or reduced volatility.
- Bollinger %B (BBP): The %B indicator is close to 0.5, suggesting the stock is trading around the middle of the Bollinger Bands.
Volume Indicators:
- On-Balance Volume (OBV): The OBV has shown a slight increase over the past few days, indicating a potential accumulation of the stock by investors.
- Chaikin Money Flow (CMF): The CMF has been positive, indicating buying pressure in the stock over the analyzed period.
Key Observations and Opinions:
- Trend: The trend indicators suggest a bullish sentiment in the short term, supported by the moving averages and MACD. However, the EMA(20) needs to be monitored for a potential crossover.
- Momentum: The RSI indicates a neutral stance, while the Stochastic Oscillator signals a possible bearish momentum. Investors should be cautious of a potential reversal.
- Volatility: The narrowing Bollinger Bands and %B close to 0.5 suggest a period of consolidation or reduced volatility in the stock.
- Volume: The OBV and CMF show positive signs of accumulation and buying pressure, supporting the bullish trend.
Conclusion:
Based on the analysis of the technical indicators, the stock of VTC is likely to experience sideways consolidation in the coming days. While the trend indicators point towards a bullish sentiment, the momentum indicators signal a potential bearish momentum. The narrowing Bollinger Bands and neutral RSI further support the view of a sideways movement. Investors should closely monitor the EMA(20) crossover and Stochastic Oscillator for potential trend reversals.