Technical Analysis of VTEI 2024-05-10
Overview:
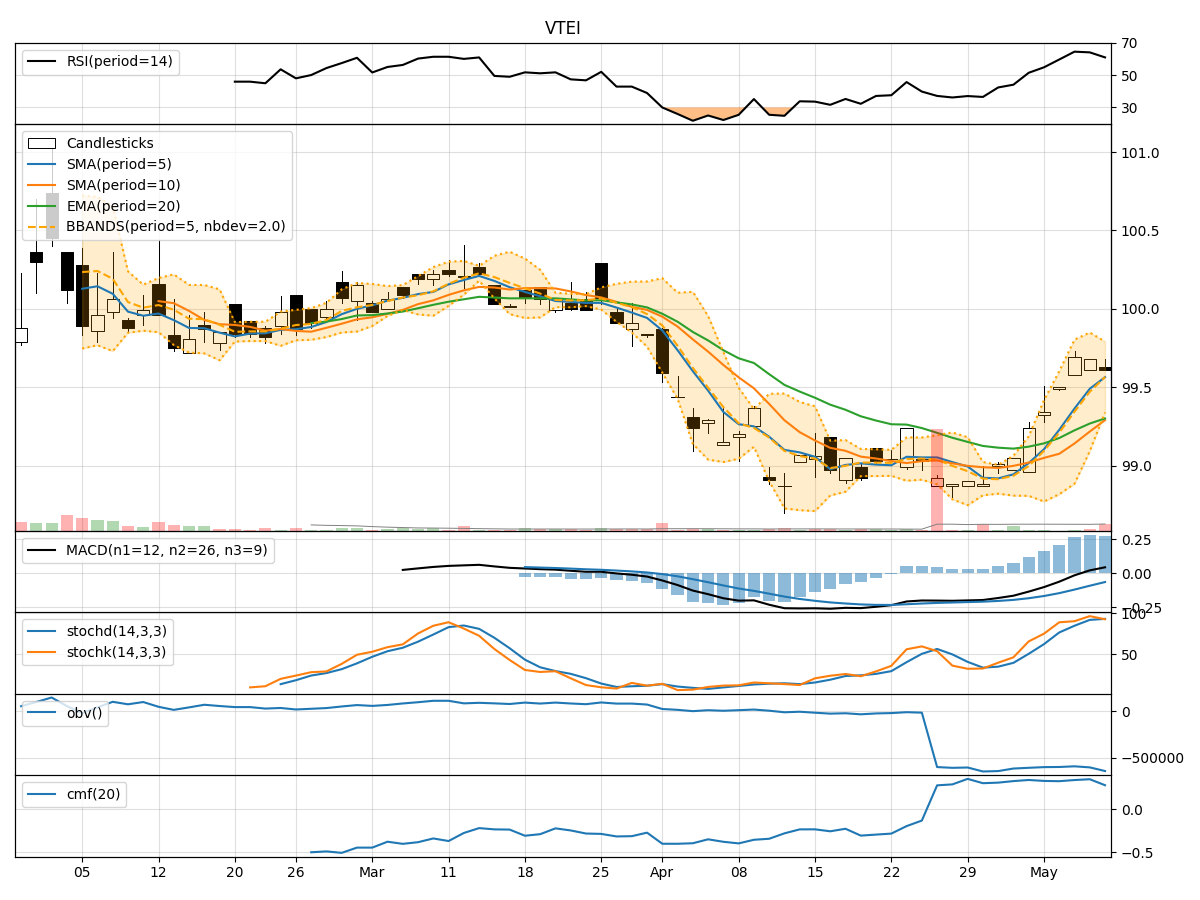
In analyzing the technical indicators for VTEI over the last 5 days, we will delve into the trend, momentum, volatility, and volume indicators to provide a comprehensive outlook on the possible stock price movement in the coming days. By examining these key aspects, we aim to offer valuable insights and predictions for potential investors.
Trend Analysis:
- Moving Averages (MA): The 5-day Moving Average (MA) has been consistently above the Simple Moving Average (SMA) and Exponential Moving Average (EMA), indicating a bullish trend.
- MACD: The MACD line has been consistently above the signal line, with the MACD histogram showing an increasing positive trend, suggesting bullish momentum.
Momentum Analysis:
- RSI: The Relative Strength Index (RSI) has been fluctuating around the 60-65 range, indicating a neutral to slightly bullish momentum.
- Stochastic Oscillator: Both %K and %D lines of the Stochastic Oscillator have been in the overbought zone, suggesting a potential reversal or consolidation.
Volatility Analysis:
- Bollinger Bands (BB): The stock price has been trading within the Bollinger Bands, with the bands narrowing, indicating decreasing volatility.
- Bollinger %B: The %B indicator has been hovering around 0.5-0.8, suggesting a neutral to slightly bullish sentiment.
Volume Analysis:
- On-Balance Volume (OBV): The OBV has been showing a slight decline, indicating some distribution happening in the stock.
- Chaikin Money Flow (CMF): The CMF has been positive but trending downwards, signaling potential weakening buying pressure.
Conclusion:
Based on the analysis of the technical indicators, the stock of VTEI is likely to experience sideways consolidation in the coming days. The bullish trend indicated by moving averages and MACD may be offset by the overbought levels in the Stochastic Oscillator and the weakening buying pressure shown by OBV and CMF. Therefore, it is recommended to exercise caution and closely monitor the price action for any potential reversal signals before making investment decisions.