Technical Analysis of VTV 2024-05-03
Overview:
In analyzing the technical indicators for VTV over the last 5 days, we will delve into the trend, momentum, volatility, and volume indicators to provide a comprehensive outlook on the possible stock price movement. By examining these key aspects, we aim to offer valuable insights and predictions for the upcoming trading days.
Trend Analysis:
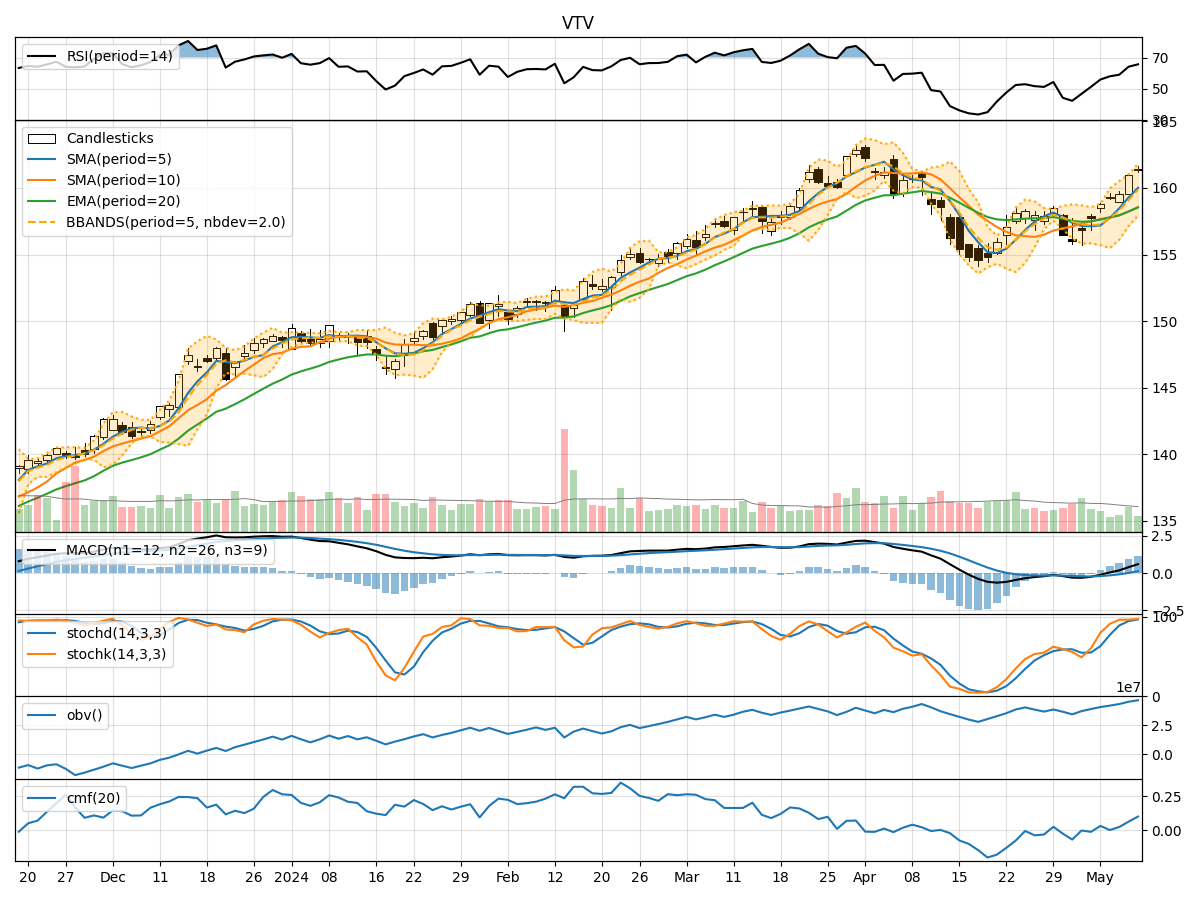
- Moving Averages (MA): The 5-day MA has been fluctuating around the closing prices, indicating short-term price trends. The SMA(10) and EMA(20) have shown a slight upward trend, suggesting a potential bullish sentiment.
- MACD: The MACD line has been consistently below the signal line, indicating a bearish trend. However, the MACD histogram has been narrowing, hinting at a possible trend reversal.
Momentum Analysis:
- RSI: The RSI has been hovering around the mid-level, indicating a neutral momentum in the stock. There is no extreme overbought or oversold conditions.
- Stochastic Oscillator: Both %K and %D have shown mixed signals, with occasional crossovers. The stock is not in a clear overbought or oversold territory.
Volatility Analysis:
- Bollinger Bands (BB): The stock price has been trading within the bands, suggesting a period of consolidation. The bands have not shown significant expansion or contraction, indicating stable volatility.
- Bollinger %B: The %B indicator has been fluctuating around 0.5, indicating that the stock is trading around the middle band without any extreme movements.
Volume Analysis:
- On-Balance Volume (OBV): The OBV has shown a slight decrease over the last few days, indicating some distribution happening in the stock.
- Chaikin Money Flow (CMF): The CMF has been negative, suggesting that money is flowing out of the stock. This could be a bearish signal for the stock price.
Conclusion:
Based on the analysis of the technical indicators, the stock price of VTV is likely to experience sideways movement in the next few days. The trend indicators show a potential bullish sentiment, while momentum indicators suggest a neutral stance. Volatility remains stable, indicating a period of consolidation, and volume indicators point towards some distribution in the stock.
Considering the overall picture, it is advisable to exercise caution and closely monitor the price action for any potential breakout or trend reversal. Traders may consider maintaining a neutral position until clearer signals emerge in the technical indicators.