Technical Analysis of VXX 2024-05-10
Overview:
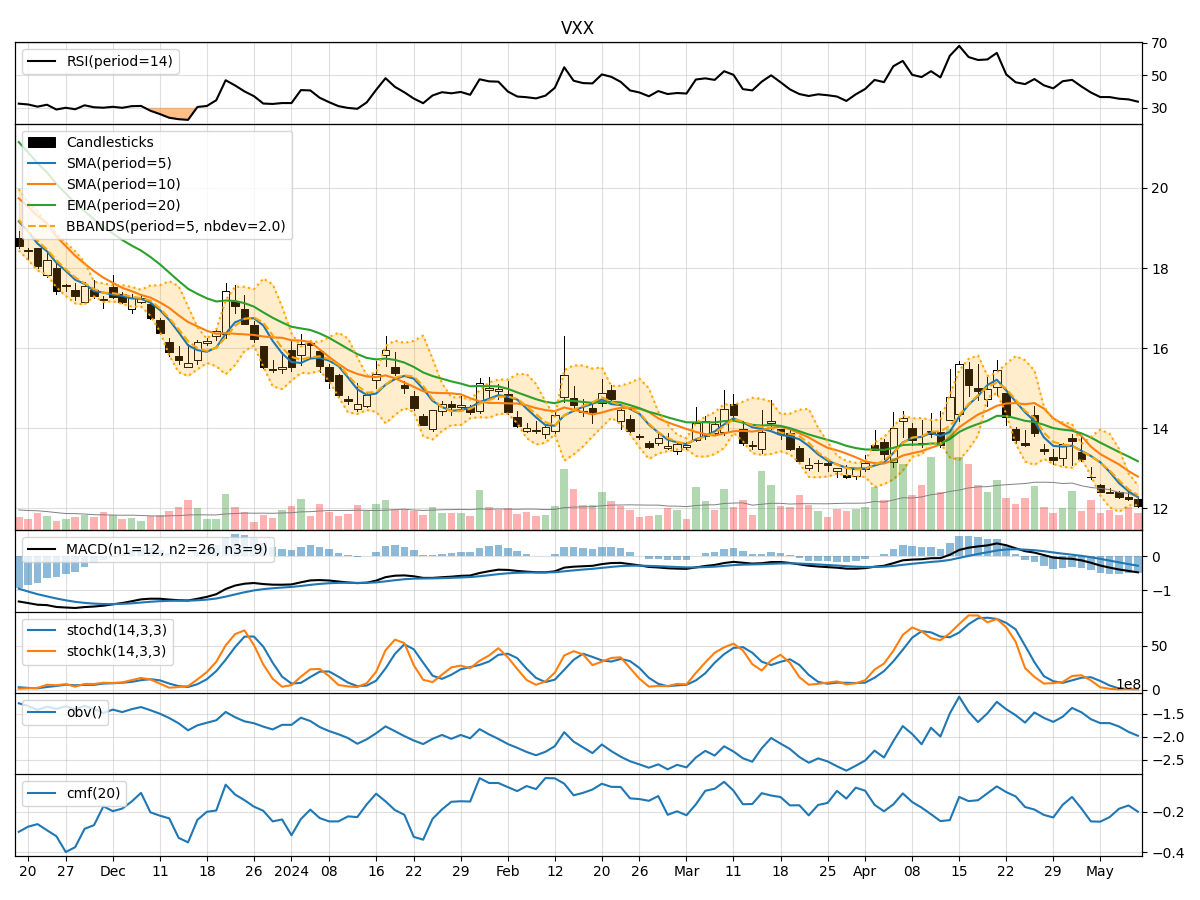
In analyzing the technical indicators for VXX over the last 5 days, we will delve into the trend, momentum, volatility, and volume indicators to provide a comprehensive outlook on the possible stock price movement in the coming days.
Trend Analysis:
- Moving Averages (MA): The 5-day Moving Average (MA) has been consistently below the longer-term Simple Moving Average (SMA) and Exponential Moving Average (EMA), indicating a downward trend.
- MACD: The Moving Average Convergence Divergence (MACD) has been negative, with the MACD line consistently below the signal line, further confirming the bearish trend.
Momentum Analysis:
- RSI: The Relative Strength Index (RSI) has been in the oversold territory, indicating a potential reversal or continuation of the downtrend.
- Stochastic Oscillator: Both %K and %D have been low, suggesting downward momentum.
- Williams %R: The Williams %R has been consistently in the oversold region, signaling a bearish sentiment.
Volatility Analysis:
- Bollinger Bands (BB): The stock price has been trading below the lower Bollinger Band, indicating oversold conditions and potential for a reversal.
- Bollinger Band Width (BBW): The Bollinger Band Width has been narrowing, suggesting a decrease in volatility.
Volume Analysis:
- On-Balance Volume (OBV): The OBV has been declining, indicating selling pressure and potential further downside.
- Chaikin Money Flow (CMF): The CMF has been negative, reflecting outflow of money from the stock.
Key Observations and Opinions:
- Trend: The trend indicators suggest a strong bearish sentiment with the stock price consistently below key moving averages and negative MACD.
- Momentum: The momentum indicators confirm the bearish trend with oversold RSI, Stochastic, and Williams %R.
- Volatility: The narrowing Bollinger Bands and decreasing volatility indicate a potential stabilization in price movement.
- Volume: The declining OBV and negative CMF point towards continued selling pressure.
Conclusion:
Based on the analysis of the technical indicators, the outlook for VXX in the next few days is bearish. The stock is likely to continue its downward trajectory, with potential for further downside movement. Traders and investors should exercise caution and consider shorting or staying on the sidelines until a clear reversal pattern emerges.