Technical Analysis of WGMI 2024-05-10
Overview:
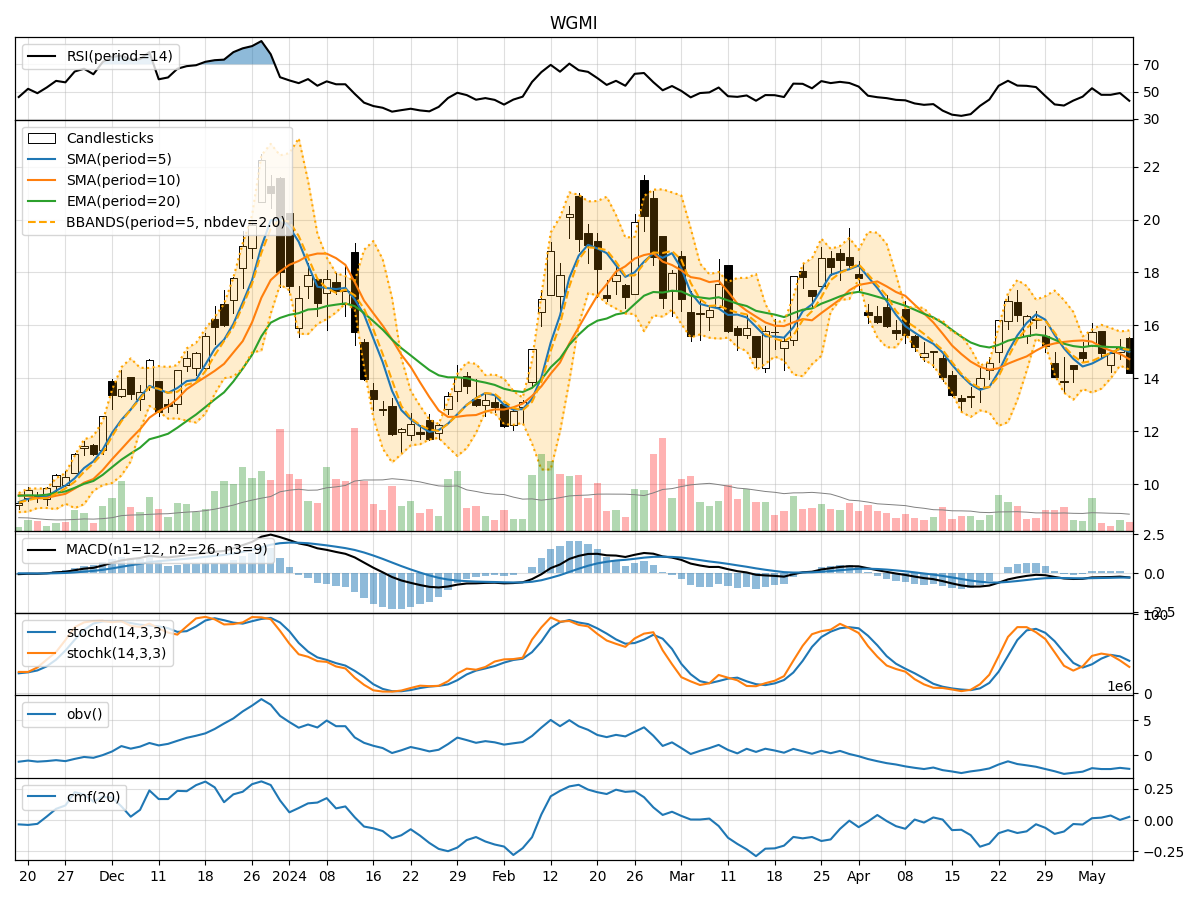
In analyzing the technical indicators for WGMI over the last 5 days, we will delve into the trend, momentum, volatility, and volume indicators to provide a comprehensive outlook on the possible stock price movement in the coming days. By examining these key aspects, we aim to offer valuable insights and predictions to guide your investment decisions.
Trend Analysis:
- Moving Averages (MA): The 5-day MA has been fluctuating around the closing prices, indicating short-term price trends. The SMA(10) and EMA(20) show a downward trend, suggesting a bearish sentiment in the medium to long term.
- MACD: The MACD line has been consistently below the signal line, indicating a bearish trend in the stock price momentum.
- Conclusion: The trend indicators point towards a downward trajectory for WGMI.
Momentum Analysis:
- RSI: The RSI has been hovering around the 50 level, indicating a neutral sentiment with no clear overbought or oversold conditions.
- Stochastic Oscillator: Both %K and %D have been declining, suggesting weakening momentum.
- Conclusion: The momentum indicators reflect a neutral to bearish outlook for WGMI.
Volatility Analysis:
- Bollinger Bands (BB): The stock price has been trading within the bands, with the %B indicator showing a slight deviation from the upper band.
- Conclusion: Volatility remains stable with no significant spikes or drops.
Volume Analysis:
- On-Balance Volume (OBV): The OBV has been fluctuating, indicating mixed buying and selling pressure.
- Chaikin Money Flow (CMF): The CMF has been relatively low, suggesting a lack of strong buying or selling momentum.
- Conclusion: Volume indicators suggest indecisiveness in the market sentiment.
Overall Conclusion:
Based on the analysis of trend, momentum, volatility, and volume indicators, the overall outlook for WGMI in the next few days leans towards a downward movement. The bearish trend indicated by moving averages and MACD, coupled with neutral to bearish momentum signals and mixed volume indicators, suggest a lack of strong buying interest and potential for further price declines.
Recommendation:
Considering the technical indicators and the prevailing market dynamics, it is advisable to exercise caution with WGMI and consider potential short-term downside risks. Traders may look for opportunities to capitalize on potential short positions or wait for more clarity in the price action before considering long positions. Monitoring key support levels and staying updated on any significant developments that could impact the stock price is crucial in navigating the market effectively.