Technical Analysis of WTBN 2024-05-10
Overview:
In analyzing the technical indicators for WTBN stock over the last 5 days, we will delve into the trend, momentum, volatility, and volume indicators to provide a comprehensive outlook on the possible stock price movement in the coming days. By examining these key aspects, we aim to offer valuable insights and predictions for potential investors.
Trend Analysis:
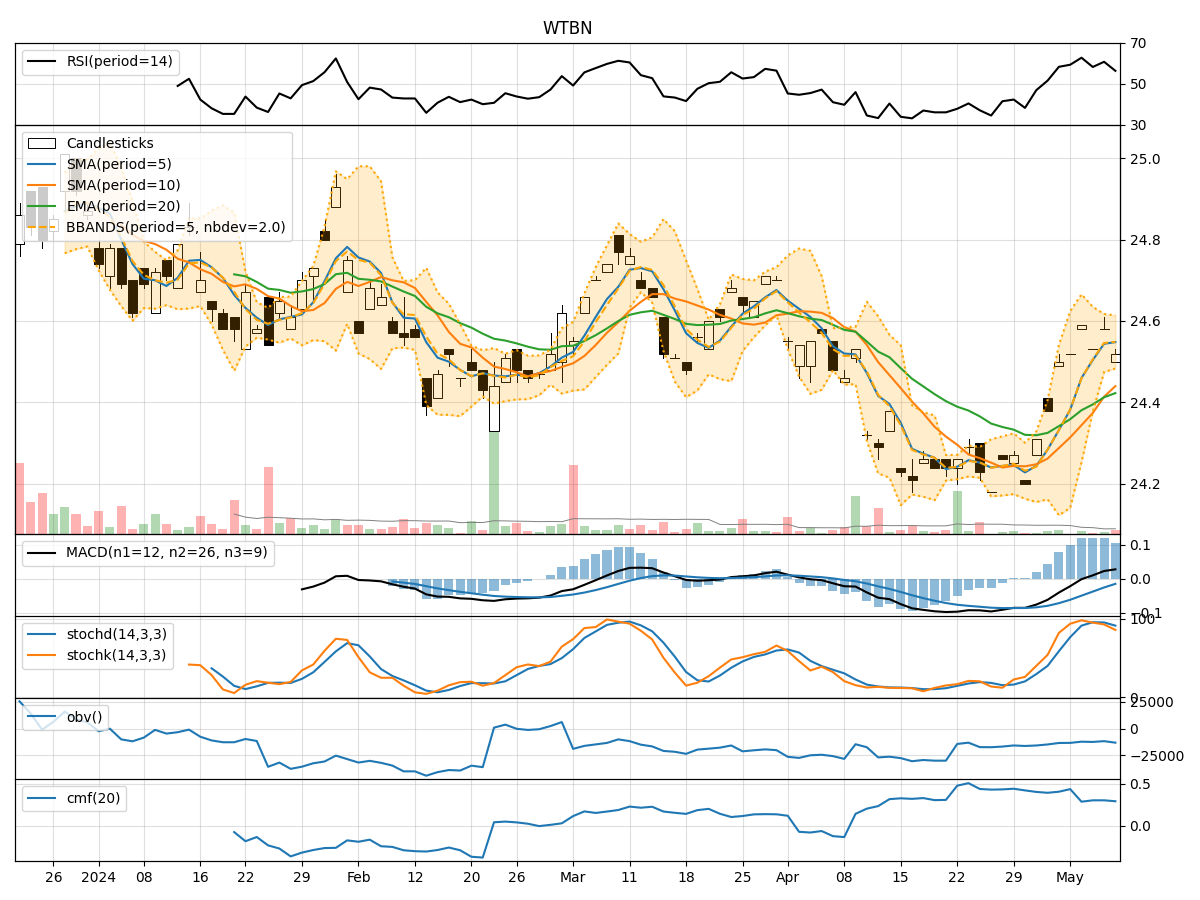
- Moving Averages (MA): The 5-day Moving Average (MA) has been consistently above the Simple Moving Average (SMA) and Exponential Moving Average (EMA), indicating a bullish trend.
- MACD: The MACD line has been consistently above the signal line, suggesting a bullish momentum in the stock price.
- RSI: The Relative Strength Index (RSI) has been fluctuating around the neutral zone, indicating a balanced momentum in the stock.
Momentum Analysis:
- Stochastic Oscillator: The Stochastic Oscillator shows that the stock has been in the overbought territory, suggesting a potential reversal in the short term.
- Williams %R: The Williams %R indicator has been in the oversold region, indicating a possible buying opportunity.
Volatility Analysis:
- Bollinger Bands: The Bollinger Bands have been narrowing, indicating decreasing volatility in the stock price.
- Average True Range (ATR): The ATR has been relatively stable, suggesting consistent price movements.
Volume Analysis:
- On-Balance Volume (OBV): The OBV indicator has shown mixed signals, reflecting indecision among investors.
- Chaikin Money Flow (CMF): The CMF has been positive, indicating buying pressure in the stock.
Key Observations:
- The trend indicators suggest a bullish sentiment in the stock price.
- Momentum indicators show conflicting signals with the Stochastic Oscillator in the overbought region and Williams %R in the oversold region.
- Volatility has been decreasing, indicating a potential consolidation phase.
- Volume indicators reflect mixed signals with OBV showing slight accumulation and CMF indicating buying pressure.
Conclusion:
Based on the analysis of the technical indicators, the next few days' possible stock price movement for WTBN is likely to be sideways with a slight bullish bias. Investors should closely monitor the Stochastic Oscillator and Williams %R for potential reversal signals. Additionally, keeping an eye on volume trends and any breakout from the current consolidation phase will be crucial in making informed trading decisions.