Technical Analysis of WTID 2024-05-10
Overview:
In analyzing the technical indicators for WTID over the last 5 days, we will delve into the trend, momentum, volatility, and volume indicators to provide a comprehensive outlook on the possible stock price movement in the coming days. By examining these key indicators, we aim to offer valuable insights and predictions for informed decision-making.
Trend Indicators:
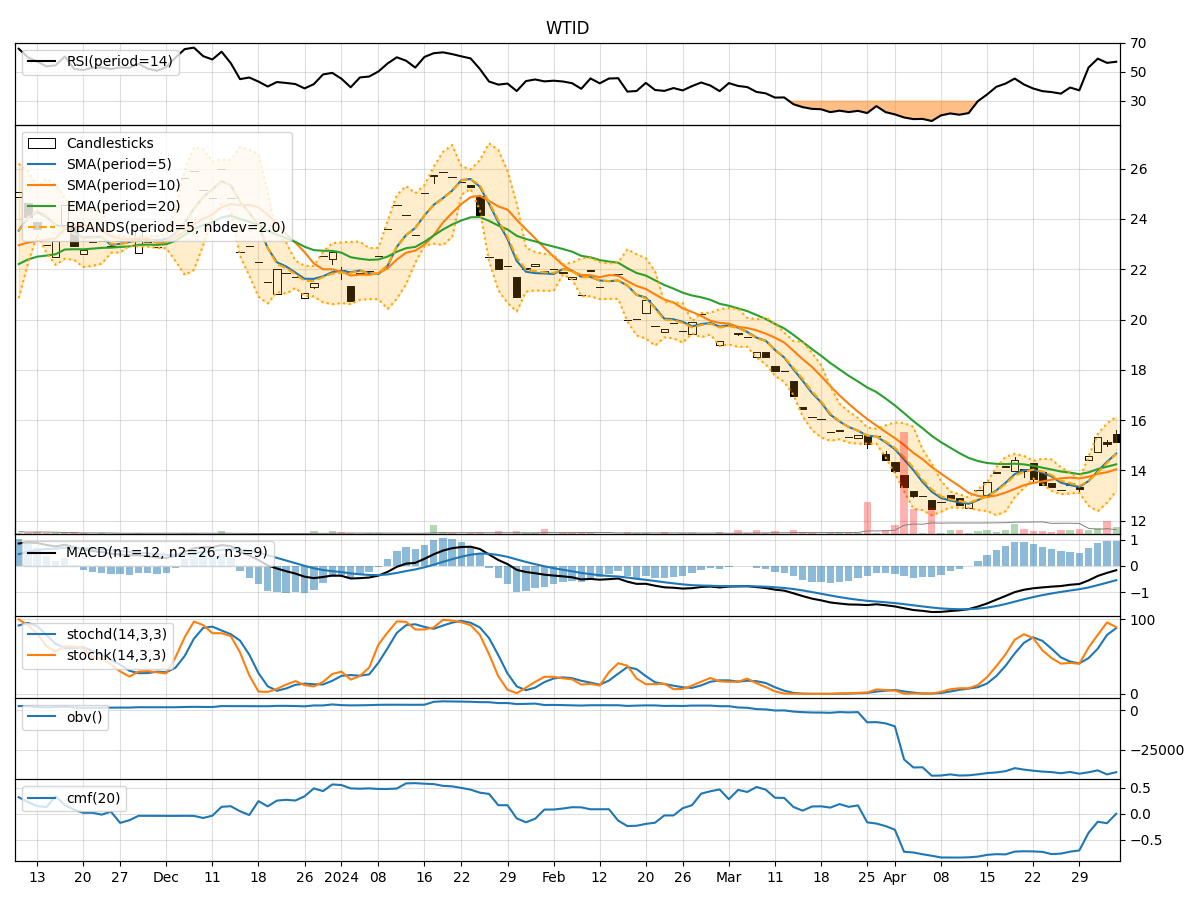
- Moving Averages (MA): The 5-day MA has been fluctuating around the closing prices, indicating short-term price trends. The SMA(10) and EMA(20) show a general uptrend, suggesting a positive momentum in the mid to long term.
- MACD: The MACD line has been consistently below the signal line, indicating a bearish trend. However, the MACD histogram has been gradually decreasing, hinting at a potential reversal.
- Conclusion: The trend indicators suggest a mixed outlook with a short-term bearish bias but a potential reversal in the mid-term.
Momentum Indicators:
- RSI: The RSI values have been fluctuating around the neutral 50 level, indicating a lack of strong momentum in either direction.
- Stochastic Oscillator: Both %K and %D have been hovering in the neutral zone, suggesting a balanced momentum.
- Conclusion: The momentum indicators reflect a neutral stance with no clear directionality in the stock's movement.
Volatility Indicators:
- Bollinger Bands (BB): The stock price has been trading within the bands, indicating a stable price range. The %B value has been fluctuating around the midline, suggesting moderate volatility.
- Conclusion: Volatility indicators point towards a sideways movement with no significant breakout expected in the near term.
Volume Indicators:
- On-Balance Volume (OBV): The OBV values have been fluctuating, indicating a balance between buying and selling pressure.
- Chaikin Money Flow (CMF): The CMF values have been positive, suggesting a net inflow of money into the stock.
- Conclusion: Volume indicators imply a balanced accumulation with no clear dominance of buying or selling pressure.
Overall Conclusion:
Based on the analysis of trend, momentum, volatility, and volume indicators, the next few days for WTID stock are likely to see sideways movement with a neutral bias. The stock may consolidate within the current price range, with a potential for a mid-term reversal in trend. Traders and investors should closely monitor key support and resistance levels for potential breakout opportunities.
Key Recommendations:
- Monitor Price Levels: Watch for any breakout above or below the Bollinger Bands for potential trend confirmation.
- Track Volume Patterns: Keep an eye on volume spikes to gauge the strength of any potential price movements.
- Consider Mid-Term Outlook: Factor in the potential reversal indicated by the moving averages for mid-term investment decisions.
In conclusion, while the short-term outlook remains uncertain, the mid-term prospects for WTID stock show signs of a possible trend reversal. It is essential to stay vigilant and adapt to changing market dynamics to capitalize on potential opportunities.