Technical Analysis of XFLX 2024-05-10
Overview:
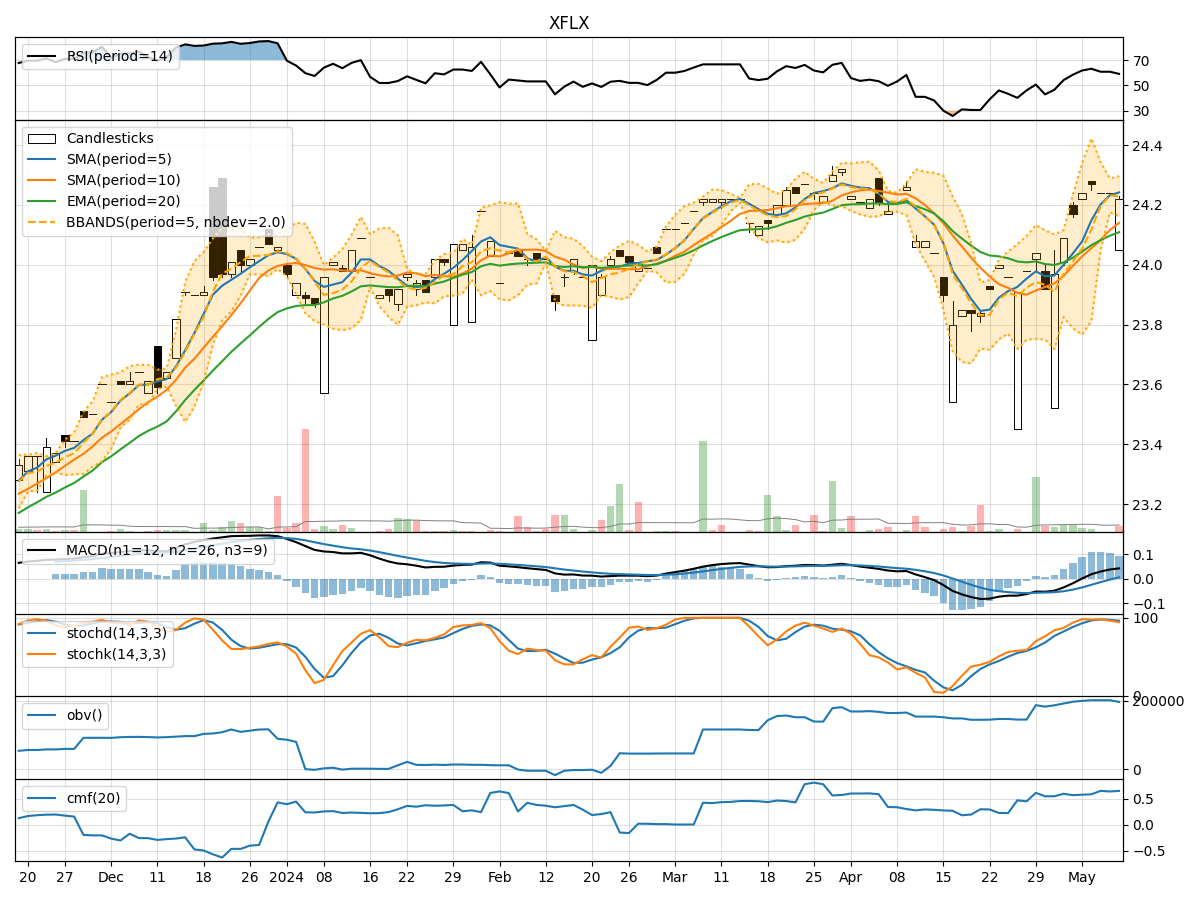
In analyzing the technical indicators for XFLX over the last 5 days, we will delve into the trend, momentum, volatility, and volume indicators to provide a comprehensive outlook on the possible stock price movement. By examining these key aspects, we aim to offer valuable insights and predictions for the upcoming days.
Trend Indicators:
- Moving Averages (MA): The 5-day MA has been consistently above the closing price, indicating a short-term uptrend.
- MACD: The MACD line has been above the signal line, suggesting bullish momentum.
- RSI: The RSI has been fluctuating around the 60-65 range, indicating a neutral stance.
Momentum Indicators:
- Stochastic Oscillator: The Stochastic Oscillator has been gradually declining but remains in the overbought territory.
- Williams %R (WillR): The WillR indicator has been moving lower into oversold levels.
Volatility Indicators:
- Bollinger Bands (BB): The stock price has been trading within the bands, showing a lack of significant volatility.
- Average True Range (ATR): ATR has been relatively stable, indicating consistent price movement.
Volume Indicators:
- On-Balance Volume (OBV): The OBV has been relatively flat, suggesting a balance between buying and selling pressure.
- Chaikin Money Flow (CMF): CMF has been positive, indicating accumulation in the stock.
Key Observations:
- The trend indicators suggest a bullish bias with the MA and MACD supporting upward momentum.
- Momentum indicators show a slight weakening in buying pressure but remain in overbought territory.
- Volatility indicators indicate a lack of significant price fluctuations.
- Volume indicators reflect a balanced accumulation and distribution scenario.
Conclusion:
Based on the analysis of the technical indicators, the stock price of XFLX is likely to experience sideways consolidation in the upcoming days. The bullish trend supported by moving averages and MACD may lead to some upward movements, but the momentum indicators hint at a potential pullback or consolidation phase. The lack of significant volatility and balanced volume further support the sideways movement. Traders should be cautious and monitor key support and resistance levels for potential entry or exit points.
Recommendation:
- Short-term Traders: Consider taking profits on any existing long positions and wait for clearer signals before entering new trades.
- Long-term Investors: Hold positions with a watchful eye on key technical levels for potential adjustments in the portfolio.
- Risk Management: Implement stop-loss orders to protect gains and manage downside risk effectively.
By combining insights from various technical indicators, traders and investors can make informed decisions aligned with the current market dynamics. Remember to stay updated on market developments and adjust strategies accordingly to navigate the evolving landscape effectively.