Technical Analysis of XHYE 2024-05-10
Overview:
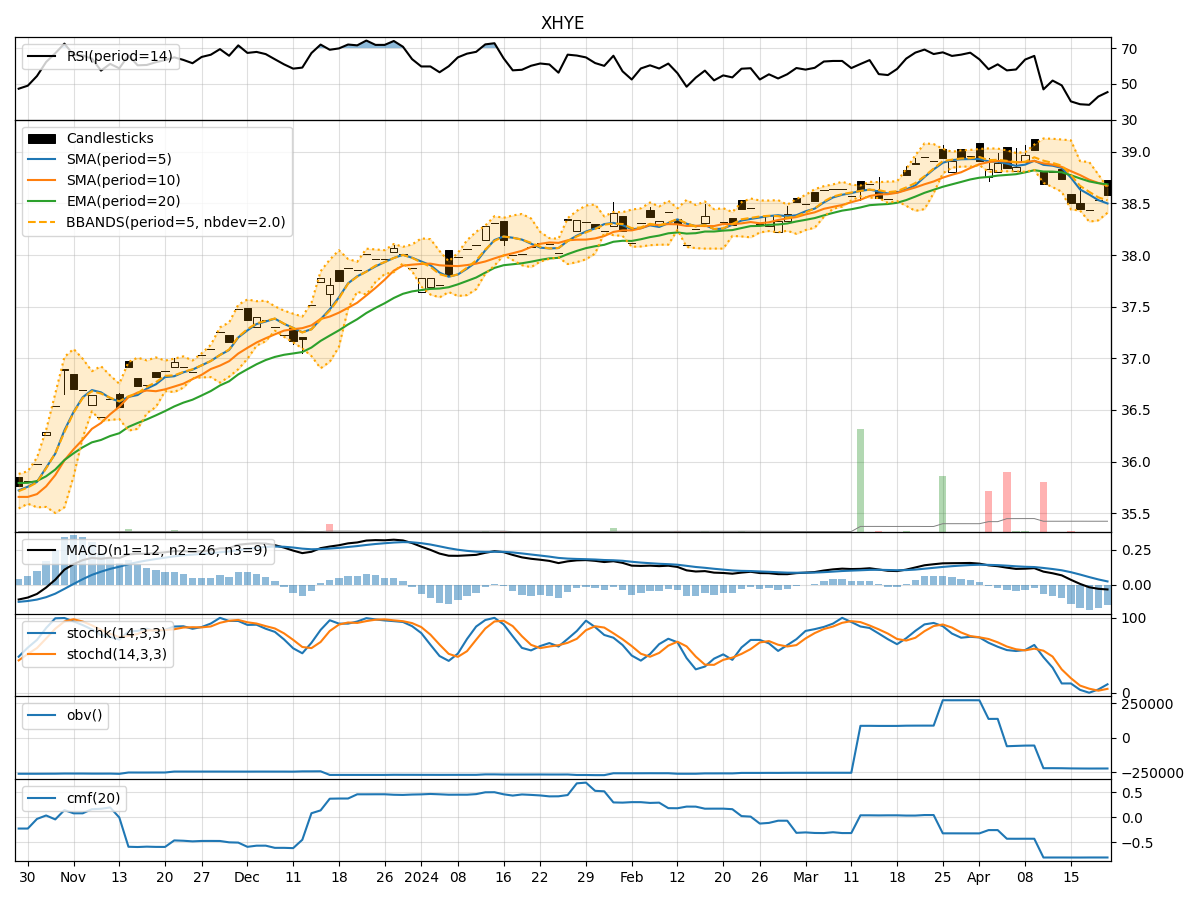
In analyzing the technical indicators for XHYE stock over the last 5 days, we will delve into the trends, momentum, volatility, and volume aspects to provide a comprehensive outlook on the possible stock price movement in the coming days. By examining key indicators such as moving averages, MACD, RSI, stochastic oscillators, Bollinger Bands, and volume analysis, we aim to offer valuable insights and predictions for potential price movements.
Trend Analysis:
- Moving Averages (MA): The 5-day moving average has been consistently above the closing prices, indicating a short-term uptrend.
- MACD: The MACD line has been above the signal line, suggesting bullish momentum.
- EMA: The exponential moving average has been trending upwards, supporting the bullish sentiment.
Momentum Analysis:
- RSI: The RSI has been in the neutral zone, indicating neither overbought nor oversold conditions.
- Stochastic Oscillators: Both %K and %D have been gradually decreasing but remain in the overbought territory.
- Williams %R: The Williams %R is in the oversold region, suggesting a potential reversal.
Volatility Analysis:
- Bollinger Bands: The stock price has been trading within the bands, indicating a period of consolidation.
- Bollinger Band Width: The band width has been narrowing, suggesting reduced volatility.
- Bollinger Band %B: The %B indicator is close to 0.5, reflecting a balanced market sentiment.
Volume Analysis:
- On-Balance Volume (OBV): The OBV has been relatively stable, indicating no significant divergence between price and volume.
- Chaikin Money Flow (CMF): The CMF has been negative, signaling selling pressure in the market.
Key Observations:
- The stock is currently in a short-term uptrend based on moving averages and MACD.
- Momentum indicators show mixed signals with RSI in a neutral zone and stochastic oscillators indicating overbought conditions.
- Volatility has been decreasing, suggesting a potential period of consolidation.
- Volume indicators do not show strong divergence, indicating a lack of significant buying or selling pressure.
Conclusion:
Based on the analysis of technical indicators, the stock is likely to experience a period of consolidation in the coming days. The mixed signals from momentum indicators and the narrowing Bollinger Bands point towards a potential sideways movement. Traders should exercise caution and wait for clearer signals before taking significant positions. It is advisable to closely monitor the price action and key support/resistance levels for any potential breakout or reversal.