Technical Analysis of XHYF 2024-05-10
Overview:
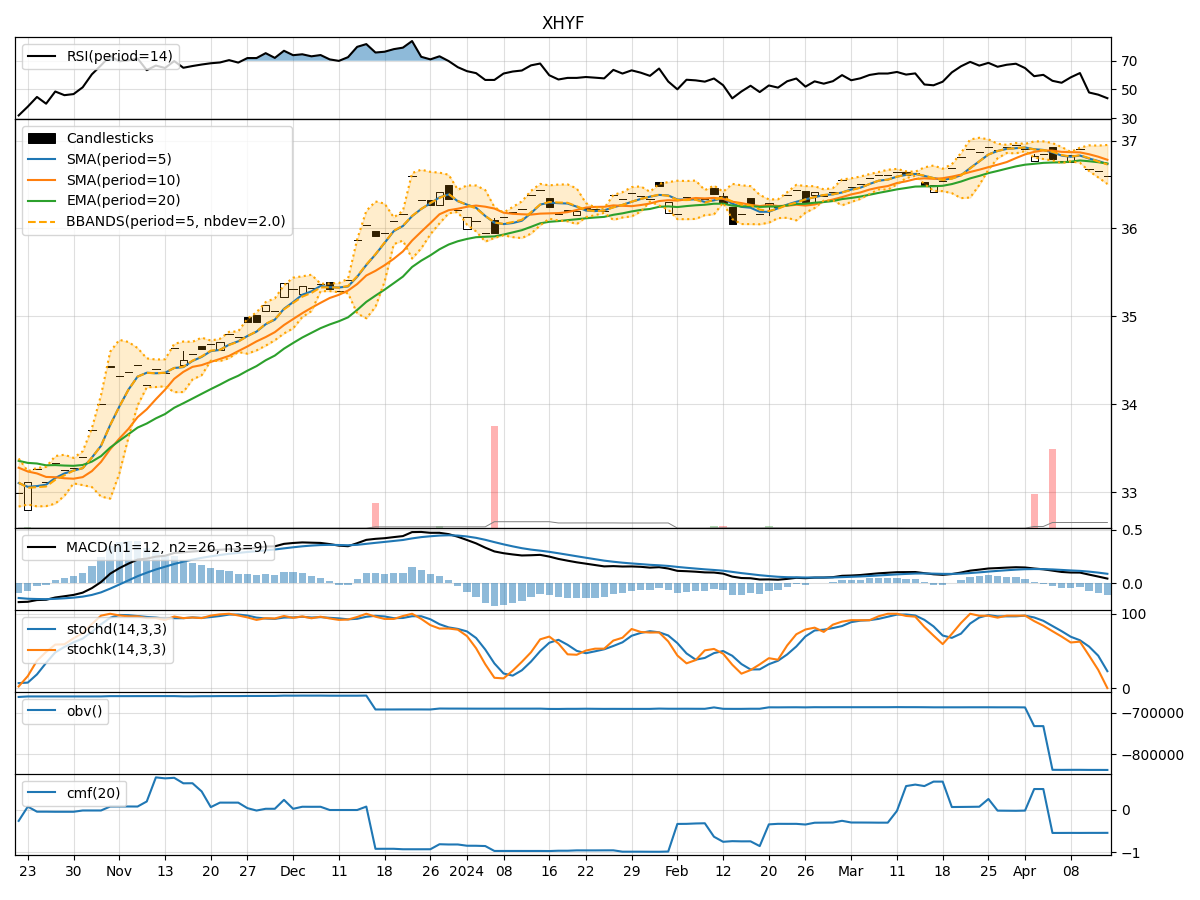
In the last 5 trading days, XHYF stock has shown a relatively stable performance with minor fluctuations in price and volume. The trend indicators suggest a slight uptrend, supported by moving averages and MACD signals. Momentum indicators indicate a weakening bullish momentum, while volatility indicators show a narrowing Bollinger Bands range. Volume indicators reflect a consistent selling pressure.
Trend Analysis:
- Moving Averages (MA): The 5-day MA is above both the 10-day SMA and the 20-day EMA, indicating a short-term uptrend.
- MACD: The MACD line is above the signal line, with both lines showing a positive trend, suggesting bullish momentum.
Key Observation: The trend indicators point towards a bullish sentiment in the short term.
Momentum Analysis:
- RSI: The RSI is above 50 but showing a slight decline, indicating weakening buying pressure.
- Stochastic Oscillator: Both %K and %D are decreasing, suggesting a loss in upward momentum.
Key Observation: Momentum indicators signal a weakening bullish momentum.
Volatility Analysis:
- Bollinger Bands (BB): The Bollinger Bands are narrowing, indicating decreasing price volatility.
Key Observation: Volatility indicators suggest a reduction in price volatility.
Volume Analysis:
- On-Balance Volume (OBV): The OBV is consistently negative, indicating persistent selling pressure.
- Chaikin Money Flow (CMF): The CMF is negative, reflecting a lack of buying interest.
Key Observation: Volume indicators highlight a bearish sentiment with sustained selling pressure.
Conclusion:
Based on the analysis of technical indicators, the next few days' possible stock price movement for XHYF is likely to be sideways to slightly bearish. The trend indicators support a short-term bullish view, but the weakening momentum, lack of buying interest reflected in volume indicators, and decreasing price volatility suggest a potential consolidation or minor downward correction in the near future.
Recommendation: It is advisable to closely monitor the stock for any signs of a reversal in momentum or a shift in volume dynamics before making any trading decisions. Consider setting stop-loss orders to manage risk effectively in case of unexpected price movements.