Technical Analysis of XLU 2024-05-10
Overview:
In analyzing the technical indicators for XLU over the last 5 days, we will delve into the trend, momentum, volatility, and volume indicators to provide insights into the possible stock price movement in the coming days. By examining these key aspects, we aim to offer a comprehensive analysis and make informed predictions for potential price trends.
Trend Indicators:
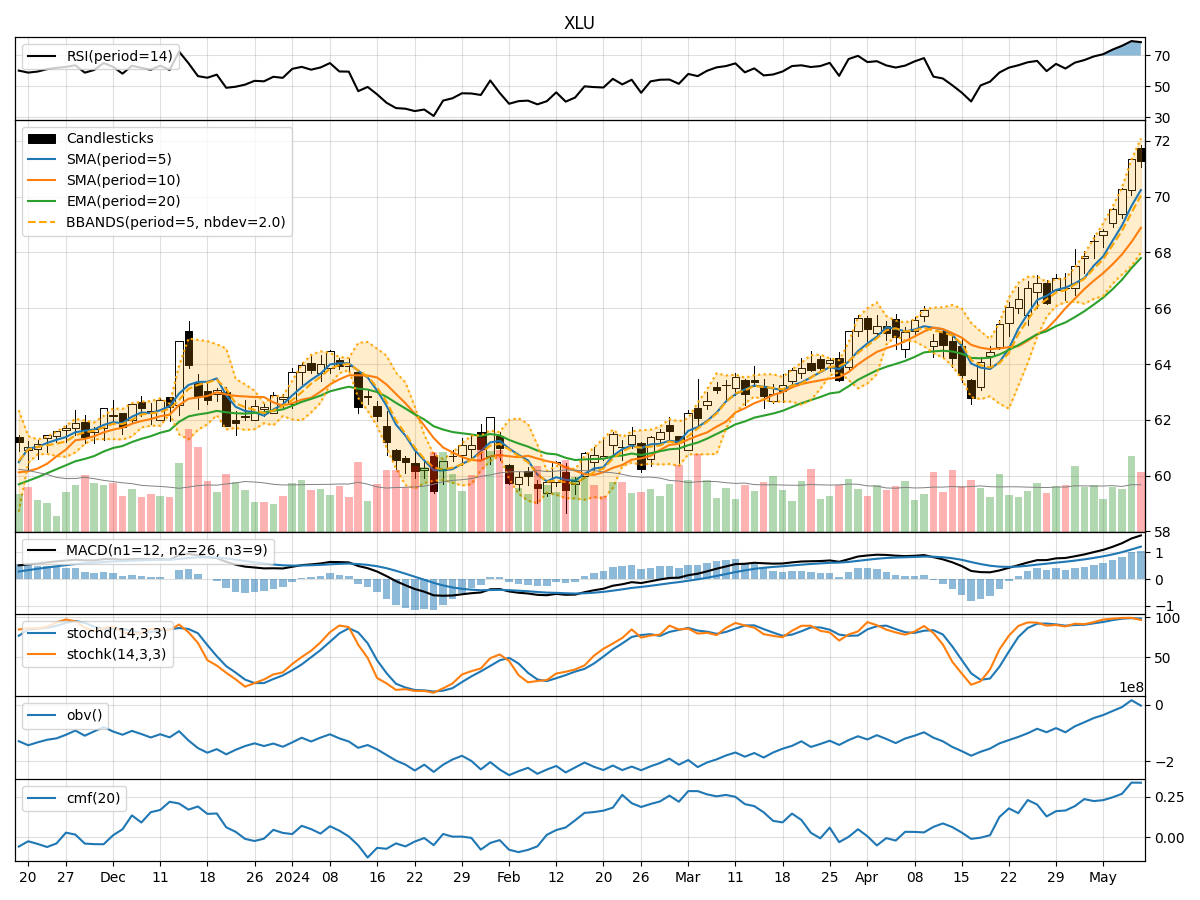
- Moving Averages (MA): The moving averages have been showing a consistent uptrend over the past 5 days, with the closing prices consistently above the short-term moving averages.
- MACD: The MACD line has been trending upwards, indicating a strengthening bullish momentum in the stock.
- EMA: The exponential moving average has been steadily increasing, reflecting a positive trend in the stock price.
Momentum Indicators:
- RSI: The Relative Strength Index has been in the overbought territory, suggesting a strong bullish momentum in the stock.
- Stochastic Oscillator: Both %K and %D have been in the overbought zone, indicating a potential reversal or consolidation in the near future.
- Williams %R: The Williams %R has been consistently in the oversold region, signaling a possible correction or pullback.
Volatility Indicators:
- Bollinger Bands: The Bollinger Bands have been widening, indicating increased volatility in the stock price.
- Bollinger %B: The %B indicator has been fluctuating within a range, suggesting potential price reversals or breakouts.
Volume Indicators:
- On-Balance Volume (OBV): The OBV has been showing a positive trend, indicating strong buying pressure in the stock.
- Chaikin Money Flow (CMF): The CMF has been consistently positive, reflecting a healthy inflow of money into the stock.
Key Observations and Opinions:
- Trend: The trend indicators suggest a strong bullish sentiment in the stock, supported by the moving averages and MACD.
- Momentum: The momentum indicators indicate an overbought condition, which could lead to a potential reversal or consolidation in the near term.
- Volatility: The widening Bollinger Bands signal increased volatility, which could result in sharp price movements.
- Volume: The volume indicators show strong buying pressure and positive money flow into the stock, supporting the bullish outlook.
Conclusion:
Based on the analysis of the technical indicators, the next few days' possible stock price movement for XLU is likely to be upward in the short term. However, given the overbought conditions in the momentum indicators and increased volatility, there might be a chance of consolidation or a minor pullback before the uptrend resumes. Traders should closely monitor key support and resistance levels for potential entry and exit points.