Technical Analysis of XXXX 2024-05-10
Overview:
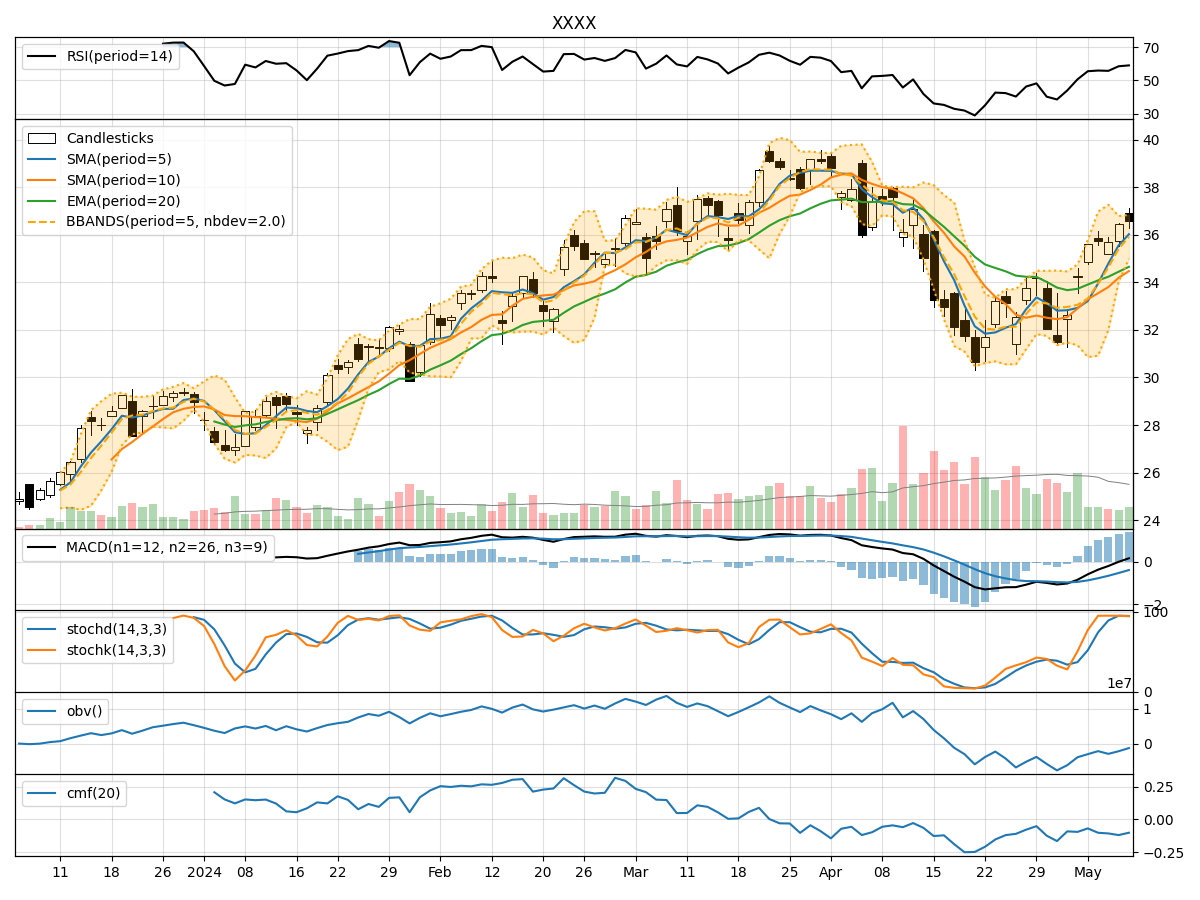
In analyzing the technical indicators for XXXX stock over the last 5 days, we will delve into the trend, momentum, volatility, and volume indicators to provide a comprehensive outlook on the possible stock price movement in the coming days. By examining these key indicators, we aim to offer valuable insights and predictions to guide your investment decisions.
Trend Indicators:
- Moving Averages (MA): The 5-day moving average has been consistently rising, indicating a bullish trend in the short term.
- MACD: The MACD line has been positive and increasing, suggesting upward momentum.
- EMA: The exponential moving average has also been trending upwards, supporting the bullish sentiment.
Momentum Indicators:
- RSI: The Relative Strength Index has been in the neutral zone, indicating potential for both upward and downward movements.
- Stochastic Oscillator: Both %K and %D have been in the overbought territory, signaling a potential reversal or consolidation.
- Williams %R: The indicator has been in the oversold region, suggesting a possible bullish reversal.
Volatility Indicators:
- Bollinger Bands: The bands have been widening, indicating increased volatility in the stock price.
- Bollinger %B: The %B indicator has been fluctuating around the midline, suggesting a period of consolidation.
Volume Indicators:
- On-Balance Volume (OBV): The OBV has been declining, indicating selling pressure in the stock.
- Chaikin Money Flow (CMF): The CMF has been negative, reflecting a bearish sentiment in the market.
Key Observations:
- The trend indicators suggest a bullish bias in the short term.
- Momentum indicators show mixed signals, with potential for both upward and downward movements.
- Volatility indicators point towards increased price fluctuations.
- Volume indicators indicate selling pressure and a bearish sentiment.
Conclusion:
Based on the analysis of the technical indicators, the stock is likely to experience sideways consolidation in the coming days. While the trend remains bullish in the short term, mixed signals from momentum indicators and negative volume indicators suggest a period of consolidation with increased volatility. Traders should exercise caution and closely monitor key support and resistance levels for potential entry or exit points.
Recommendation:
- Short-term Traders: Consider taking profits on existing positions and wait for clearer signals before entering new trades.
- Long-term Investors: Monitor the stock closely for a potential entry point during the consolidation phase.
- Risk Management: Implement tight stop-loss orders to protect capital in case of unexpected price movements.
In conclusion, while the stock shows signs of a bullish trend, the overall market dynamics indicate a period of consolidation ahead. Stay vigilant and adapt your trading strategy accordingly to navigate the upcoming market conditions effectively.