Technical Analysis of ZSL 2024-05-10
Overview:
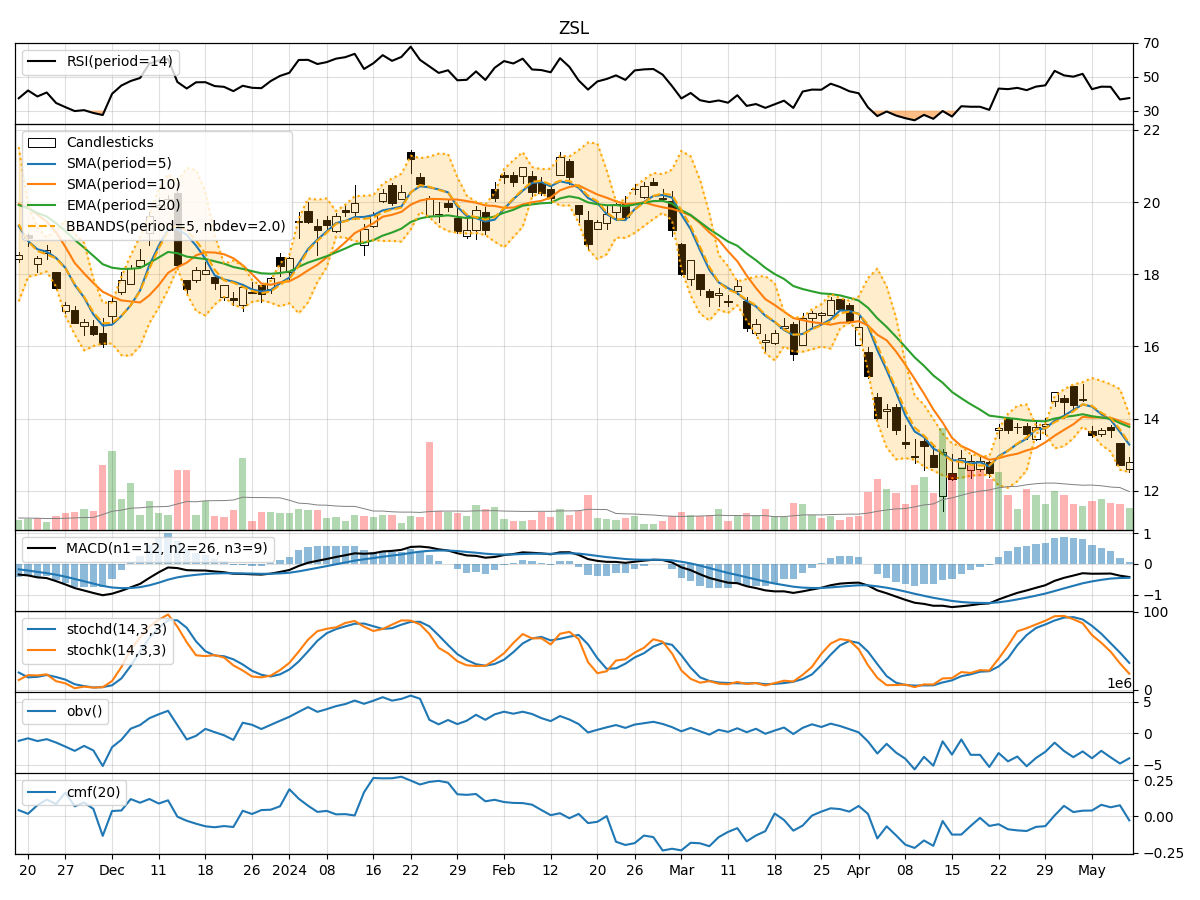
In analyzing the technical indicators for ZSL over the last 5 days, we will delve into the trend, momentum, volatility, and volume indicators to provide a comprehensive outlook on the possible stock price movement in the coming days. By examining these key indicators, we aim to offer valuable insights and predictions for informed decision-making.
Trend Indicators:
- Moving Averages (MA): The 5-day MA has been consistently below the closing prices, indicating a short-term downtrend.
- MACD: The MACD line has been negative, suggesting bearish momentum in the stock.
- RSI: The RSI has been fluctuating around the 30-70 range, indicating a lack of strong trend direction.
Momentum Indicators:
- Stochastic Oscillator: Both %K and %D have been in oversold territory, signaling potential for a reversal.
- Williams %R: The stock has been in oversold territory, indicating a possible buying opportunity.
Volatility Indicators:
- Bollinger Bands: The stock price has been trading within the lower Bollinger Band, suggesting oversold conditions.
- Volatility: Volatility has been decreasing, indicating a potential stabilization in price movements.
Volume Indicators:
- On-Balance Volume (OBV): The OBV has been declining, suggesting selling pressure in the stock.
- Chaikin Money Flow (CMF): The CMF has been positive, indicating potential buying interest.
Key Observations:
- The stock is currently in a short-term downtrend based on moving averages and MACD.
- Momentum indicators suggest a possible reversal in the oversold territory.
- Volatility has decreased, indicating a potential stabilization in price movements.
- Volume indicators show selling pressure but with some signs of buying interest.
Conclusion:
Based on the analysis of the technical indicators, the stock is currently in a downtrend with oversold conditions as per momentum indicators. However, the decreasing volatility and potential buying interest indicated by volume indicators suggest a possible consolidation in the stock price in the coming days. Traders should watch for signs of a reversal in momentum and monitor key support and resistance levels for potential entry or exit points.