Technical Analysis of ZTAX 2024-05-10
Overview:
In analyzing the technical indicators for ZTAX over the last 5 days, we will delve into the trend, momentum, volatility, and volume indicators to provide a comprehensive outlook on the possible stock price movement in the coming days. By examining these key aspects, we aim to offer valuable insights and predictions for informed decision-making.
Trend Analysis:
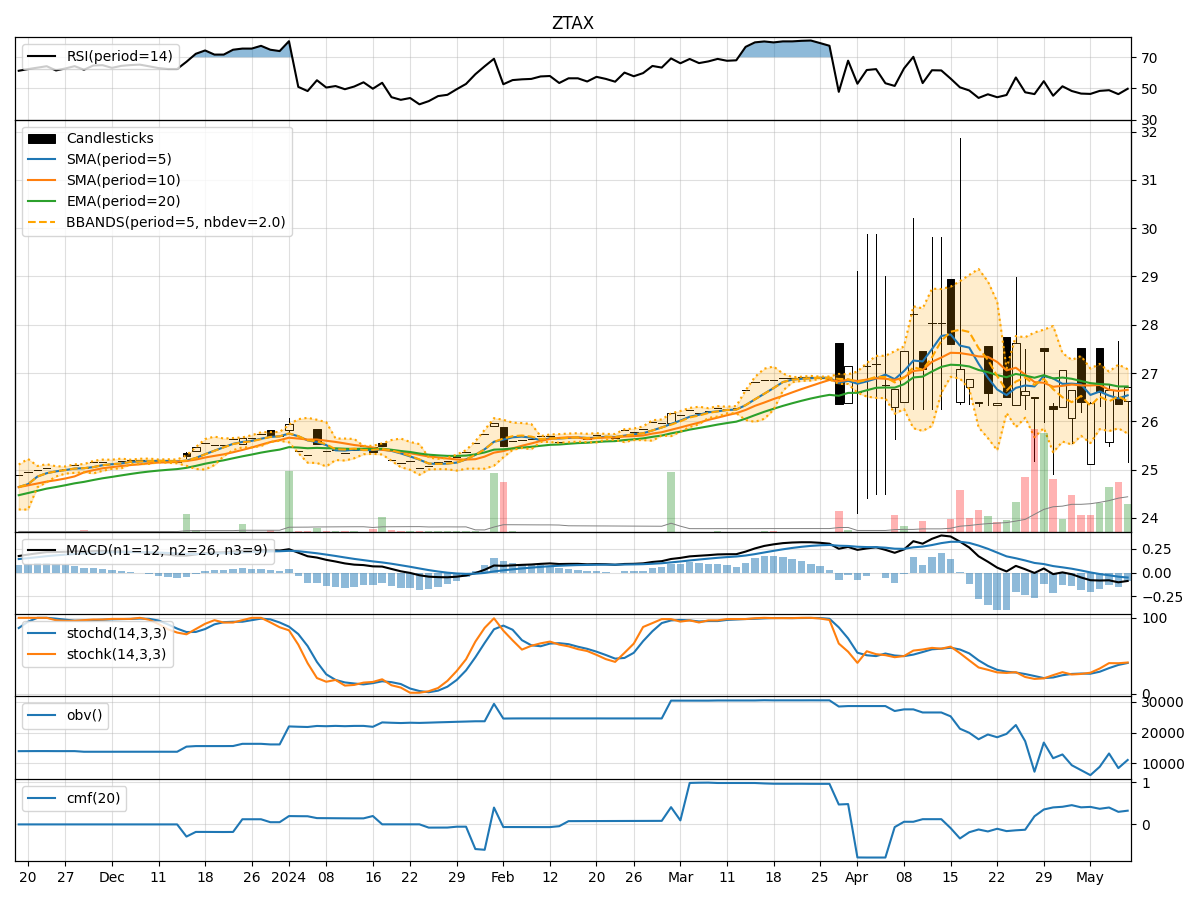
- Moving Averages (MA): The 5-day MA has been fluctuating around the closing prices, indicating short-term price trends. The SMA(10) and EMA(20) have shown a slight decline, suggesting a potential weakening trend.
- MACD and Signal Line: The MACD has been negative, with the MACD line consistently below the signal line. This indicates a bearish momentum in the stock price.
- Conclusion: The trend indicators point towards a bearish outlook for ZTAX in the near term.
Momentum Analysis:
- RSI (14): The RSI has been hovering around the mid-range, indicating a lack of strong momentum in either direction.
- Stochastic Oscillator: Both %K and %D have been relatively flat, suggesting a lack of clear direction in momentum.
- Williams %R: The Williams %R is also near the oversold territory, indicating a potential reversal.
- Conclusion: The momentum indicators suggest a sideways movement or a potential reversal in the stock price.
Volatility Analysis:
- Bollinger Bands (BB): The stock price has been trading within the Bollinger Bands, with the bands narrowing in recent days. This could signal a period of reduced volatility.
- Conclusion: The volatility indicators imply a consolidation phase with reduced price fluctuations.
Volume Analysis:
- On-Balance Volume (OBV): The OBV has shown a slight decline, indicating some selling pressure in the stock.
- Chaikin Money Flow (CMF): The CMF has also decreased, suggesting a decrease in buying pressure.
- Conclusion: The volume indicators point towards a bearish sentiment with more selling pressure.
Overall Conclusion:
Based on the analysis of trend, momentum, volatility, and volume indicators, the overall outlook for ZTAX in the next few days is bearish with a potential for sideways movement. The trend indicators signal a weakening trend, while momentum indicators suggest a lack of clear direction. Volatility indicators point towards a consolidation phase, and volume indicators indicate increased selling pressure.
Recommendation:
Considering the bearish sentiment and lack of strong momentum, it is advisable to exercise caution when trading ZTAX in the coming days. Traders may consider implementing risk management strategies and closely monitoring key support and resistance levels for potential entry or exit points. Additionally, staying informed about any market developments or news that could impact the stock price is crucial for making well-informed decisions.