Technical Analysis of BACA 2024-05-31
Overview:
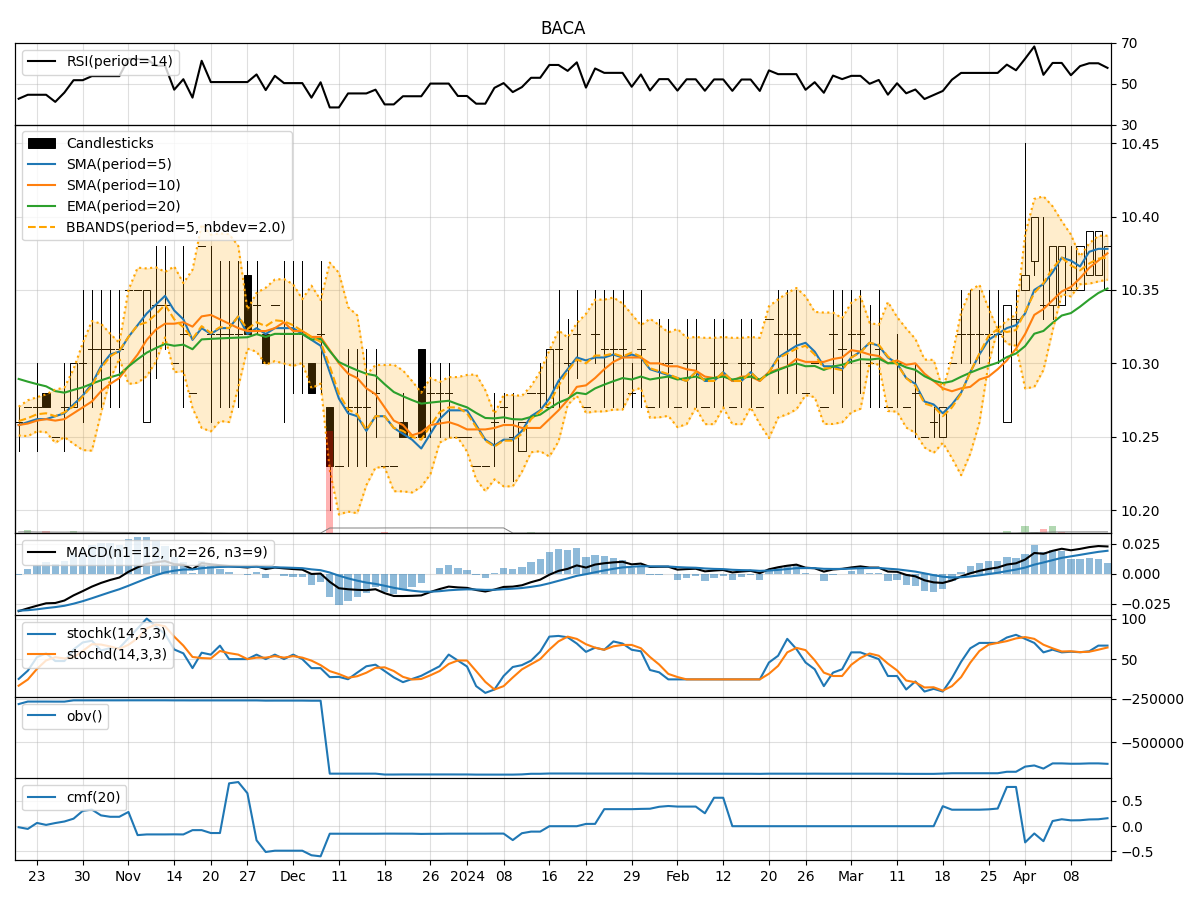
In analyzing the technical indicators for BACA stock over the last 5 days, we will delve into the trends, momentum, volatility, and volume aspects to provide a comprehensive outlook on the possible future stock price movement. By examining key indicators such as moving averages, MACD, RSI, Bollinger Bands, and OBV, we aim to offer valuable insights and predictions for the upcoming trading days.
Trend Analysis:
- Moving Averages (MA): The 5-day moving average has been relatively stable around $10.55, indicating a consistent price level.
- MACD: The MACD line has shown slight positive movement, suggesting a potential bullish momentum.
- EMA: The exponential moving average has been gradually increasing, reflecting a positive trend in the stock price.
Momentum Analysis:
- RSI: The RSI of 58.39 on the last trading day indicates a slightly overbought condition but still within a reasonable range.
- Stochastic Oscillator: Both %K and %D have been in the mid-range, suggesting a neutral momentum.
- Williams %R: The Williams %R at -34.78 indicates a slightly bullish sentiment.
Volatility Analysis:
- Bollinger Bands: The stock price has been trading within the Bollinger Bands, with the bands narrowing, indicating reduced volatility.
- Bollinger %B: The %B value of 1.0 on the last trading day suggests the price is at the upper band, potentially signaling a short-term overbought condition.
Volume Analysis:
- On-Balance Volume (OBV): The OBV has shown a slight increase over the last few days, indicating some accumulation by investors.
- Chaikin Money Flow (CMF): The CMF at 0.017 suggests a slight inflow of money into the stock over the past 20 days.
Conclusion:
Based on the analysis of the technical indicators, the stock of BACA is showing signs of bullish momentum in the short term. The moving averages, MACD, and EMA all point towards a potential uptrend. The momentum indicators like RSI and Stochastic Oscillator are in neutral territory, indicating room for further upside. However, the overbought conditions suggested by Williams %R and Bollinger %B may lead to a temporary consolidation or a minor pullback before a potential continuation of the uptrend.
Considering the overall technical picture, it is likely that BACA stock will experience further upside movement in the next few trading days. Traders and investors may consider buying on dips or holding their positions to capitalize on the expected bullish trend. It is essential to monitor the price action closely and set appropriate stop-loss levels to manage risk effectively.