Technical Analysis of AAPL 2024-05-10
Overview:
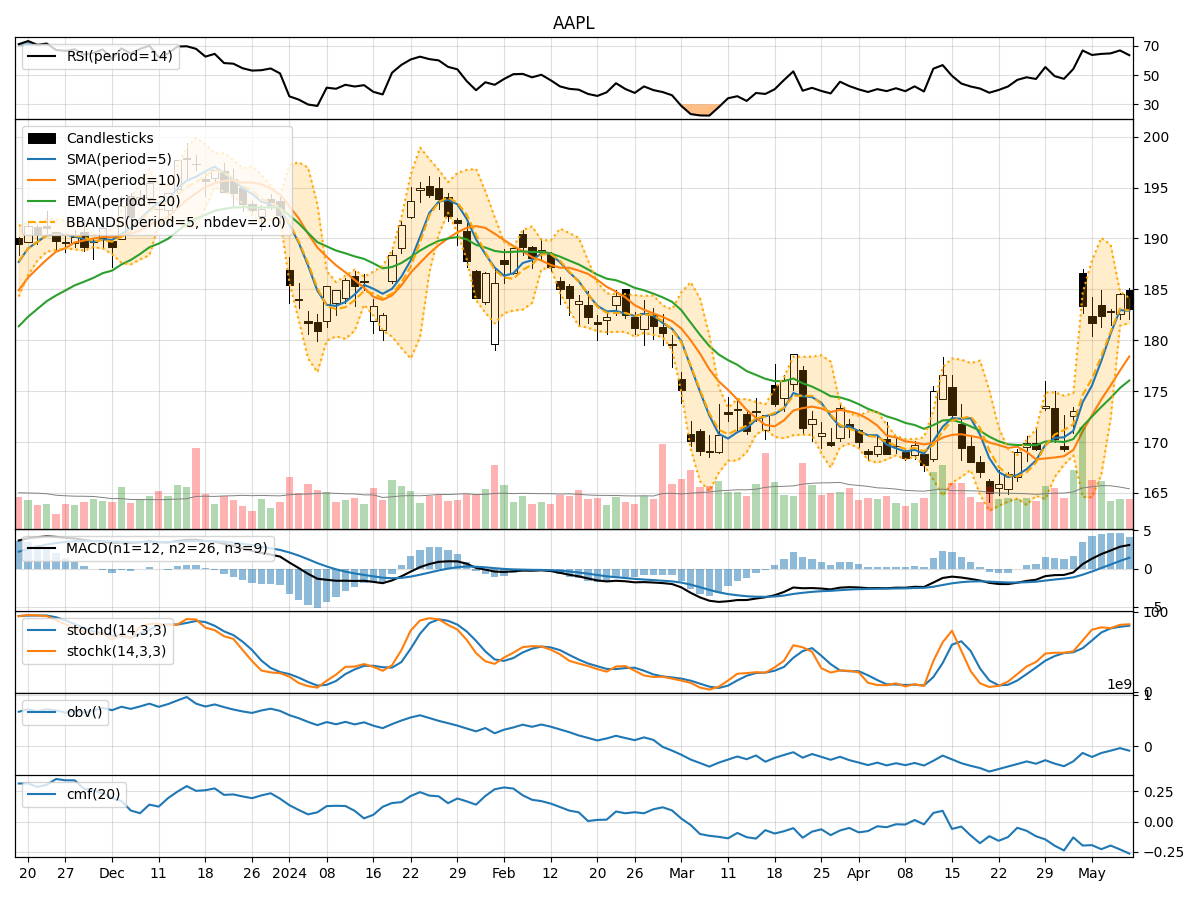
In analyzing the technical indicators for AAPL over the last 5 days, we will delve into the trend, momentum, volatility, and volume indicators to provide a comprehensive outlook on the possible stock price movement in the coming days. By examining these key factors, we aim to offer valuable insights and predictions for potential investors and traders.
Trend Indicators:
- Moving Averages (MA): The 5-day moving average has been consistently above the longer-term moving averages (SMA and EMA), indicating a bullish trend.
- MACD: The MACD line has been trending upwards, crossing above the signal line, suggesting increasing bullish momentum.
- MACD Histogram: The histogram has been positive, indicating a strengthening bullish trend.
Momentum Indicators:
- RSI: The RSI has been in the overbought territory, suggesting a strong bullish momentum.
- Stochastic Oscillator: Both %K and %D have been in the overbought zone, indicating a potential reversal or consolidation.
- Williams %R: The indicator has been in the oversold region, signaling a potential reversal to the upside.
Volatility Indicators:
- Bollinger Bands: The price has been trading within the bands, with the bands narrowing, indicating decreasing volatility.
- Bollinger %B: The %B indicator has been hovering around the middle, suggesting a balanced market sentiment.
Volume Indicators:
- On-Balance Volume (OBV): The OBV has been declining, indicating selling pressure in the market.
- Chaikin Money Flow (CMF): The CMF has been negative, reflecting a bearish money flow trend.
Key Observations and Opinions:
- Trend: The trend indicators suggest a strong bullish sentiment in the short term.
- Momentum: While momentum indicators show overbought conditions, the potential for a reversal or consolidation is likely.
- Volatility: Volatility has been decreasing, indicating a possible period of consolidation or sideways movement.
- Volume: The declining OBV and negative CMF signal bearish sentiment in the market.
Conclusion:
Based on the analysis of the technical indicators, the next few days for AAPL could see a potential consolidation or sideways movement as the stock may take a breather from the recent bullish rally. Traders should exercise caution and monitor key support and resistance levels closely. A short-term correction or pullback could also be on the horizon given the overbought conditions in the momentum indicators. It is advisable to wait for clearer signals or confirmation before making significant trading decisions.