Technical Analysis of ADBE 2024-05-10
Overview:
In analyzing the technical indicators for Adobe Inc. (ADBE) over the last 5 days, we will delve into the trend, momentum, volatility, and volume indicators to provide a comprehensive outlook on the possible stock price movement in the coming days.
Trend Indicators:
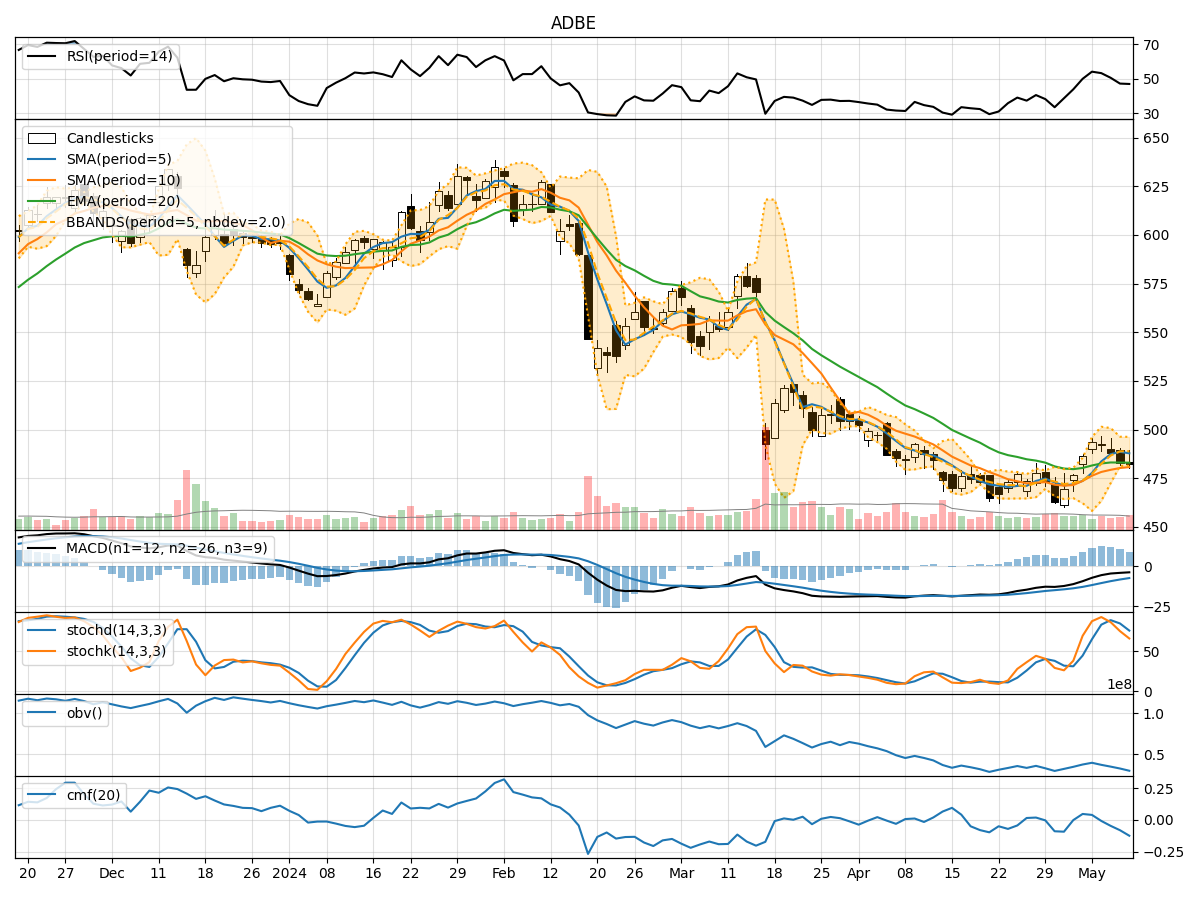
- Moving Averages (MA): The 5-day Moving Average (MA) has been consistently above the Simple Moving Average (SMA) and Exponential Moving Average (EMA), indicating a short-term bullish trend.
- MACD: The Moving Average Convergence Divergence (MACD) has been negative but showing signs of convergence, suggesting a potential reversal in the bearish trend.
- MACD Histogram: The MACD Histogram has been decreasing but is approaching the zero line, indicating a possible shift in momentum.
Momentum Indicators:
- RSI: The Relative Strength Index (RSI) has been declining, moving towards the oversold territory, signaling a potential reversal or consolidation.
- Stochastic Oscillator: Both %K and %D have been decreasing, indicating a bearish momentum.
- Williams %R: The Williams %R is in the oversold region, suggesting a possible reversal in the short term.
Volatility Indicators:
- Bollinger Bands: The stock price has been trading within the Bollinger Bands, with the bands narrowing, indicating reduced volatility and a potential breakout.
- Bollinger %B: The %B indicator is below 0.2, suggesting the stock is oversold and may see a reversal.
Volume Indicators:
- On-Balance Volume (OBV): The OBV has been declining, indicating selling pressure and potential bearish sentiment.
- Chaikin Money Flow (CMF): The CMF has been negative, reflecting outflow of money from the stock.
Key Observations and Opinions:
- Trend: The short-term trend is bullish based on moving averages, but the MACD signals a potential reversal.
- Momentum: Momentum indicators suggest a bearish sentiment with RSI in oversold territory and Stochastic indicators pointing downwards.
- Volatility: Volatility is decreasing, indicating a possible consolidation phase before a breakout.
- Volume: Declining OBV and negative CMF indicate weakening buying pressure and potential downside risk.
Conclusion:
Based on the analysis of the technical indicators, the stock price of ADBE is likely to experience further downward movement in the coming days. The bearish momentum, oversold conditions, and weakening volume support a bearish outlook. Traders should exercise caution and consider shorting or staying on the sidelines until clearer bullish signals emerge.