Technical Analysis of AMZN 2024-05-03
Overview:
In analyzing the technical indicators for AMZN over the last 5 days, we will delve into the trend, momentum, volatility, and volume indicators to provide a comprehensive outlook on the possible stock price movement in the coming days. By examining these key factors, we aim to offer valuable insights and predictions for informed decision-making.
Trend Analysis:
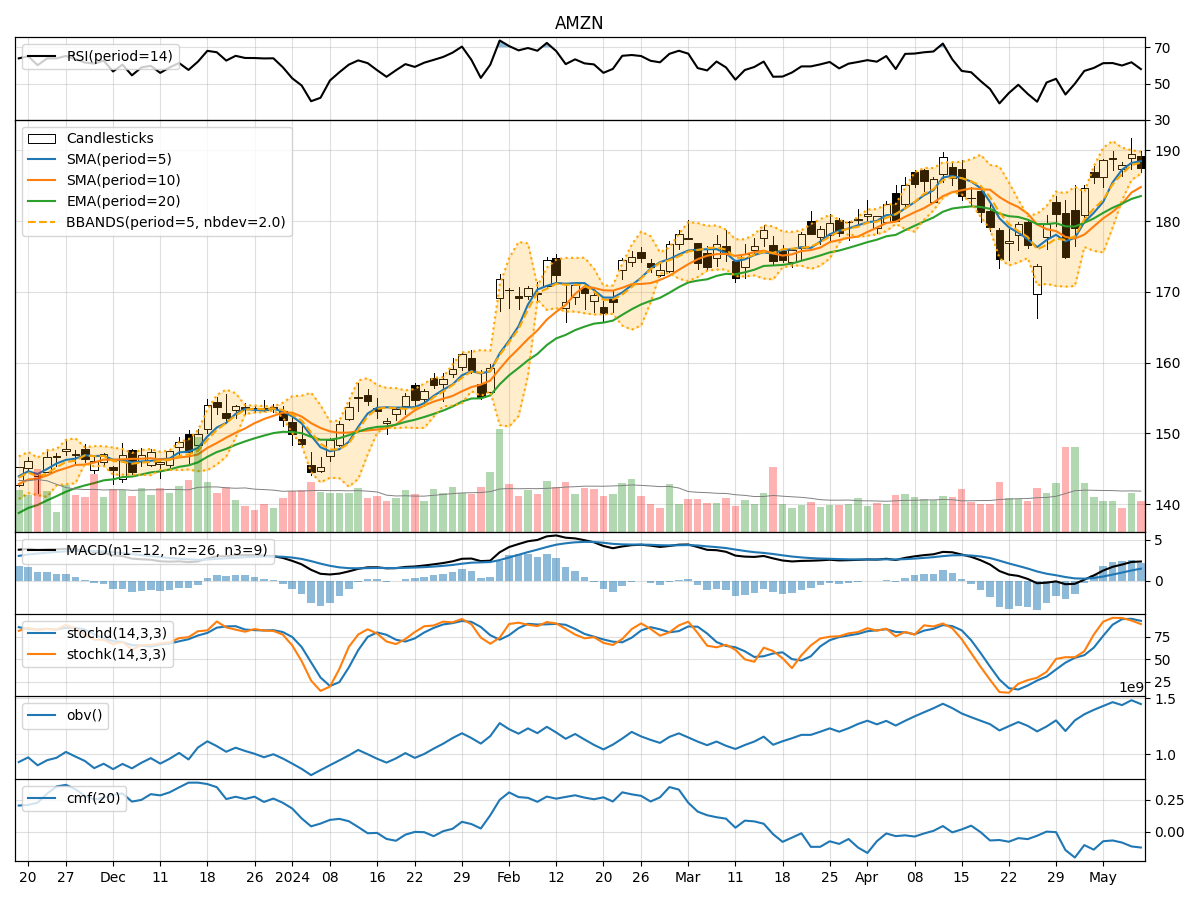
- Moving Averages (MA): The 5-day Moving Average (MA) has been fluctuating around the closing prices, indicating short-term price trends. The Simple Moving Average (SMA) and Exponential Moving Average (EMA) show a slight convergence, suggesting a potential reversal or consolidation.
- MACD: The Moving Average Convergence Divergence (MACD) has been negative but narrowing, with the MACD line approaching the signal line. This could signal a potential bullish crossover in the near future.
Momentum Analysis:
- RSI: The Relative Strength Index (RSI) has been gradually increasing, indicating strengthening bullish momentum.
- Stochastic Oscillator: Both %K and %D lines of the Stochastic Oscillator are trending upwards, suggesting increasing buying pressure.
- Williams %R: The Williams %R is moving towards oversold territory, indicating a potential buying opportunity.
Volatility Analysis:
- Bollinger Bands (BB): The Bollinger Bands are widening, indicating increased volatility in the stock price. The upper band is expanding, suggesting a potential uptrend continuation.
- Bollinger %B: The %B indicator is above 0.5, indicating a bullish momentum in the short term.
Volume Analysis:
- On-Balance Volume (OBV): The OBV has been fluctuating but showing a slight increase, indicating accumulation by investors.
- Chaikin Money Flow (CMF): The CMF is negative, suggesting some selling pressure, but the 20-day period may not fully reflect the current sentiment.
Conclusion:
Based on the analysis of the technical indicators, the overall outlook for AMZN in the next few days is bullish. The convergence of moving averages, potential MACD crossover, increasing RSI, and Stochastic indicators all point towards a possible uptrend continuation. The widening Bollinger Bands and positive Bollinger %B further support this bullish view. Although there may be short-term fluctuations due to increased volatility, the momentum and volume indicators suggest a favorable environment for further price appreciation.
Key Conclusion: Upward movement is likely in the next few days for AMZN, with potential for a bullish trend continuation. Traders and investors may consider taking long positions based on the current technical analysis.