Technical Analysis of APDN 2024-05-31
Overview:
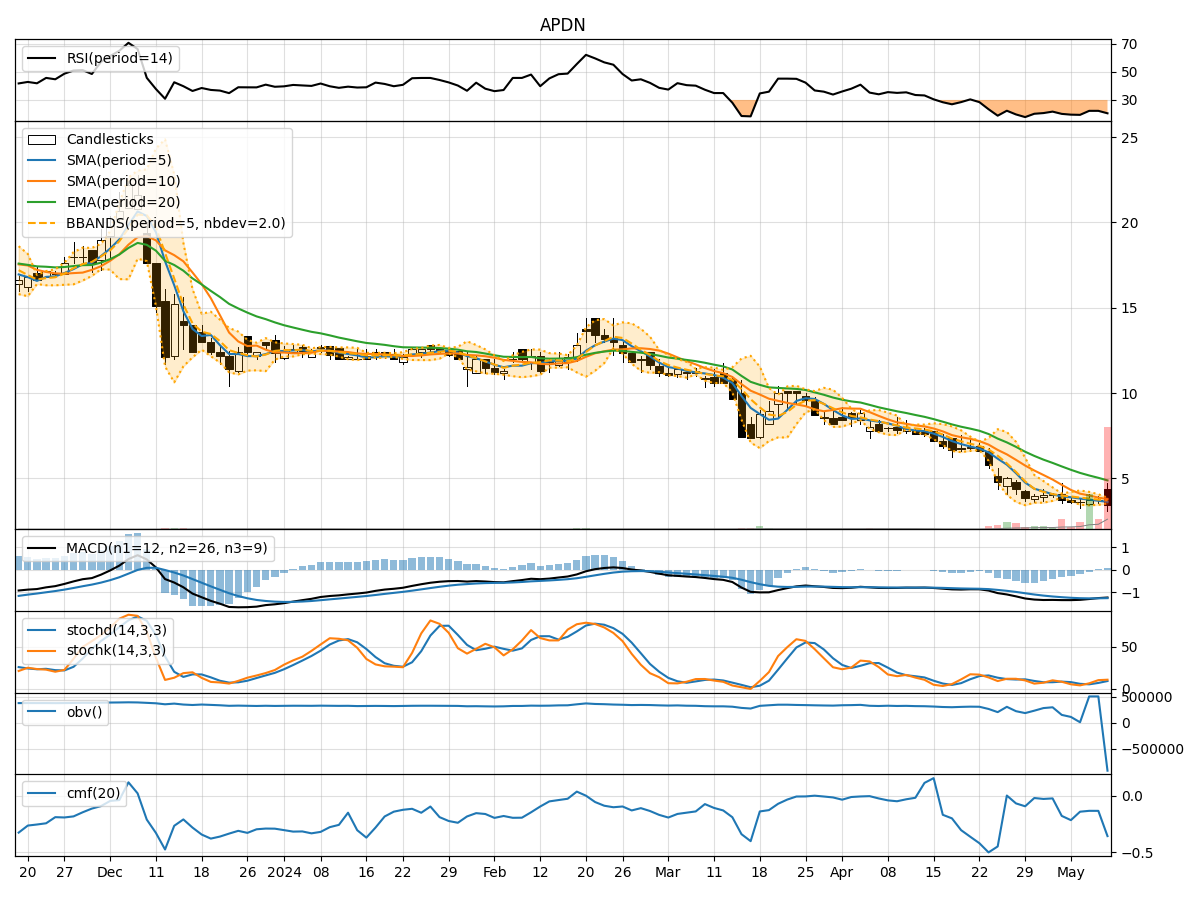
In analyzing the technical indicators for APDN over the last 5 days, we will delve into the trend, momentum, volatility, and volume indicators to provide a comprehensive outlook on the possible stock price movement. By examining these key aspects, we aim to offer valuable insights and predictions for the upcoming days.
Trend Analysis:
- Moving Averages (MA): The 5-day MA has been consistently decreasing, indicating a downward trend in the stock price.
- MACD: The MACD line has been consistently below the signal line, suggesting a bearish momentum in the stock.
- EMA: The exponential moving average has also been declining, further supporting the bearish trend.
Momentum Analysis:
- RSI: The Relative Strength Index has been low, indicating oversold conditions in the stock.
- Stochastic Oscillator: Both %K and %D have been decreasing, signaling a bearish momentum.
- Williams %R: The indicator has been in the oversold territory, suggesting a potential reversal.
Volatility Analysis:
- Bollinger Bands: The bands have been widening, indicating increased volatility in the stock price.
- Bollinger %B: The %B has been decreasing, showing that the stock price is trading closer to the lower band.
Volume Analysis:
- On-Balance Volume (OBV): The OBV has been consistently negative, reflecting selling pressure in the stock.
- Chaikin Money Flow (CMF): The CMF has been negative, indicating a lack of buying interest in the stock.
Key Observations:
- The stock is currently in a strong downtrend based on moving averages and MACD.
- Momentum indicators suggest oversold conditions, potentially hinting at a reversal.
- Volatility has increased, indicating uncertainty and potential sharp price movements.
- Volume indicators show persistent selling pressure and a lack of buying interest.
Conclusion:
Based on the analysis of technical indicators, the stock is likely to continue its downward movement in the near term. The bearish trend, coupled with oversold conditions and negative volume indicators, suggests that further downside is probable. Traders and investors should exercise caution and consider waiting for signs of a reversal before considering long positions.