Technical Analysis of ARQ 2024-05-31
Overview:
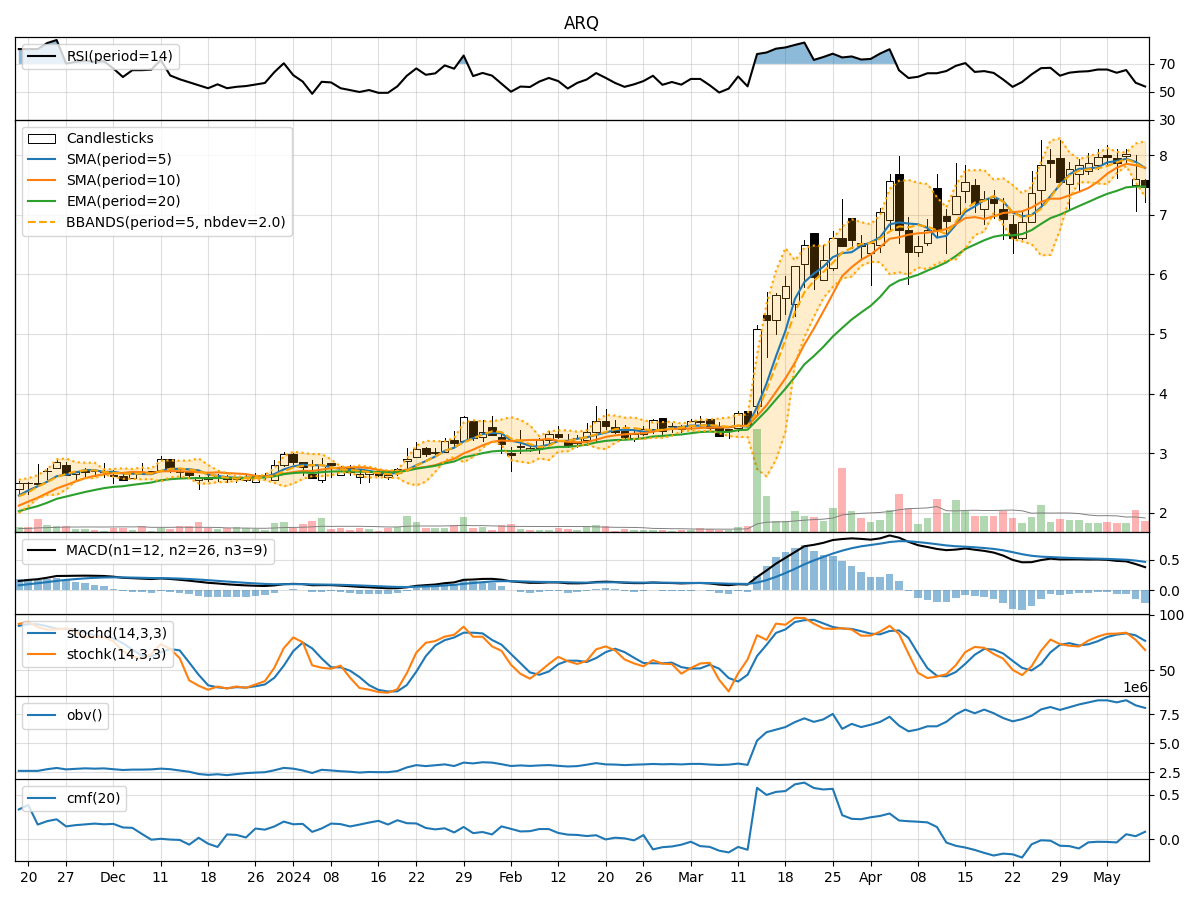
In analyzing the technical indicators for ARQ stock over the last 5 days, we will delve into the trend, momentum, volatility, and volume indicators to provide a comprehensive outlook on the possible stock price movement in the coming days.
Trend Analysis:
- Moving Averages (MA): The 5-day Moving Average (MA) has been fluctuating around the actual closing prices, indicating short-term price trends. The Simple Moving Average (SMA) and Exponential Moving Average (EMA) show a downward trend, suggesting a bearish sentiment.
- Moving Average Convergence Divergence (MACD): The MACD line has been consistently below the signal line, indicating a bearish trend in momentum.
Momentum Analysis:
- Relative Strength Index (RSI): The RSI values have been hovering around the midline, indicating a lack of strong momentum in either direction.
- Stochastic Oscillator: Both %K and %D values have been relatively low, suggesting a potential oversold condition.
Volatility Analysis:
- Bollinger Bands (BB): The Bollinger Bands have been narrowing, indicating decreasing volatility in the stock price.
Volume Analysis:
- On-Balance Volume (OBV): The OBV has been relatively stable, suggesting a balance between buying and selling pressure.
- Chaikin Money Flow (CMF): The CMF has been fluctuating around zero, indicating a neutral money flow.
Key Observations:
- The trend indicators show a bearish sentiment with declining moving averages and negative MACD values.
- Momentum indicators suggest a lack of strong momentum in either direction, with potential oversold conditions.
- Volatility has been decreasing, indicating a possible period of consolidation.
- Volume indicators reflect a balanced buying and selling pressure with neutral money flow.
Conclusion:
Based on the analysis of the technical indicators, the stock price of ARQ is likely to continue its downward trend in the next few days. The bearish sentiment indicated by the trend and momentum indicators, coupled with decreasing volatility and neutral volume indicators, suggest a potential further decline in the stock price. Traders and investors should exercise caution and consider short-term selling strategies or wait for a clearer bullish reversal signal before considering long positions.