Technical Analysis of ATOS 2024-05-31
Overview:
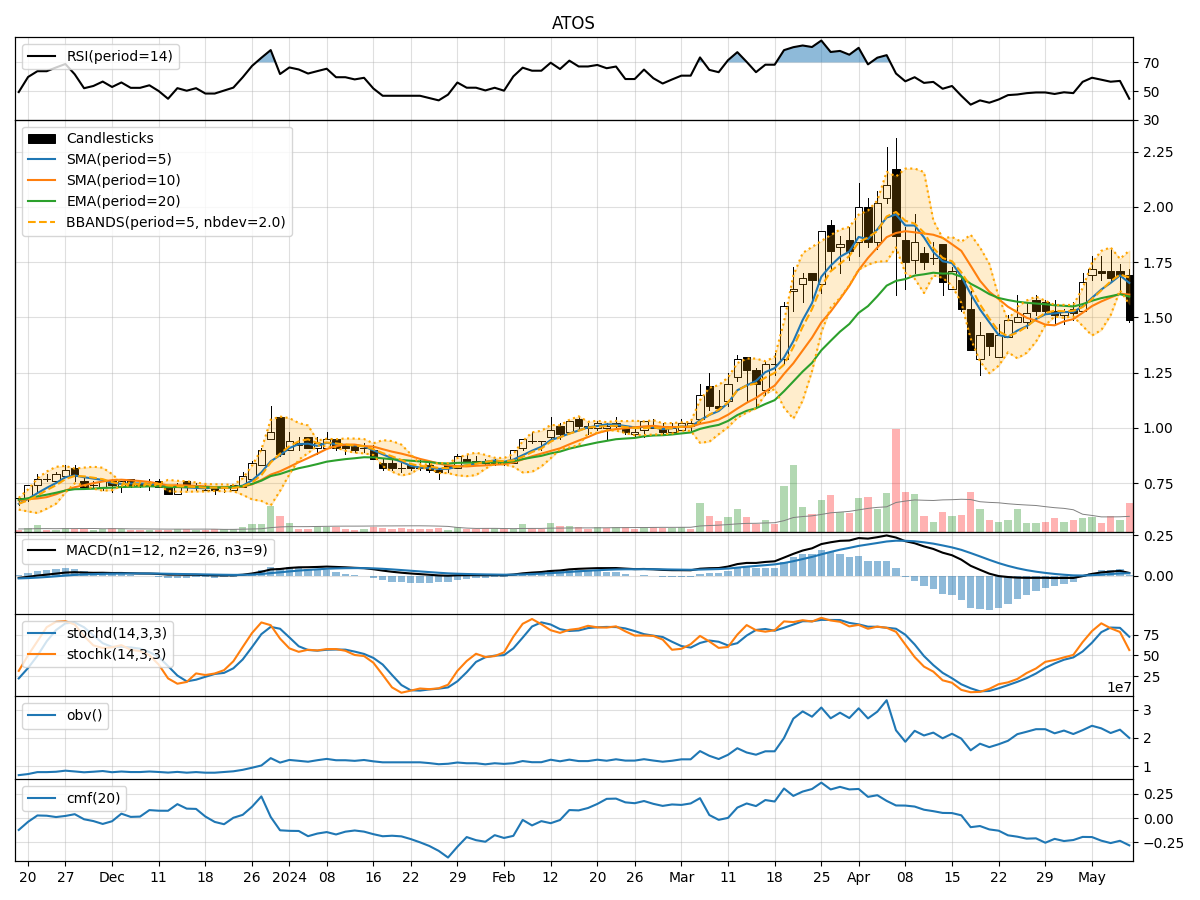
In analyzing the technical indicators for ATOS over the last 5 days, we will delve into the trend, momentum, volatility, and volume indicators to provide a comprehensive outlook on the possible stock price movement in the coming days. By examining these key aspects, we aim to offer valuable insights and predictions for informed decision-making.
Trend Analysis:
- Moving Averages (MA): The 5-day MA has been consistently decreasing, indicating a downward trend in the stock price.
- MACD: The MACD line has been negative and decreasing, suggesting bearish momentum.
- EMA: The EMA has been declining, further supporting the bearish trend.
Momentum Analysis:
- RSI: The RSI has been decreasing, reflecting weakening momentum.
- Stochastic Oscillator: Both %K and %D have been decreasing, indicating a bearish momentum.
- Williams %R: The indicator has been in oversold territory, signaling a potential reversal.
Volatility Analysis:
- Bollinger Bands (BB): The stock price has been consistently below the middle Bollinger Band, indicating a downtrend.
- BB Width: The width of the Bollinger Bands has been narrowing, suggesting decreasing volatility.
Volume Analysis:
- On-Balance Volume (OBV): The OBV has been declining, indicating selling pressure.
- Chaikin Money Flow (CMF): The CMF has been negative, reflecting outflow of money from the stock.
Key Observations:
- The stock is in a clear downtrend based on moving averages and MACD.
- Momentum indicators suggest bearish sentiment with oversold conditions.
- Volatility is decreasing, indicating a potential lack of significant price movements.
- Volume indicators show selling pressure and negative money flow.
Conclusion:
Based on the analysis of technical indicators, the next few days for ATOS are likely to see further downward movement in the stock price. The bearish trend, supported by momentum indicators and volume analysis, suggests that investors may continue to sell the stock. Traders should exercise caution and consider shorting or staying on the sidelines until a clear reversal pattern emerges.