Technical Analysis of BIGC 2024-05-10
Overview:
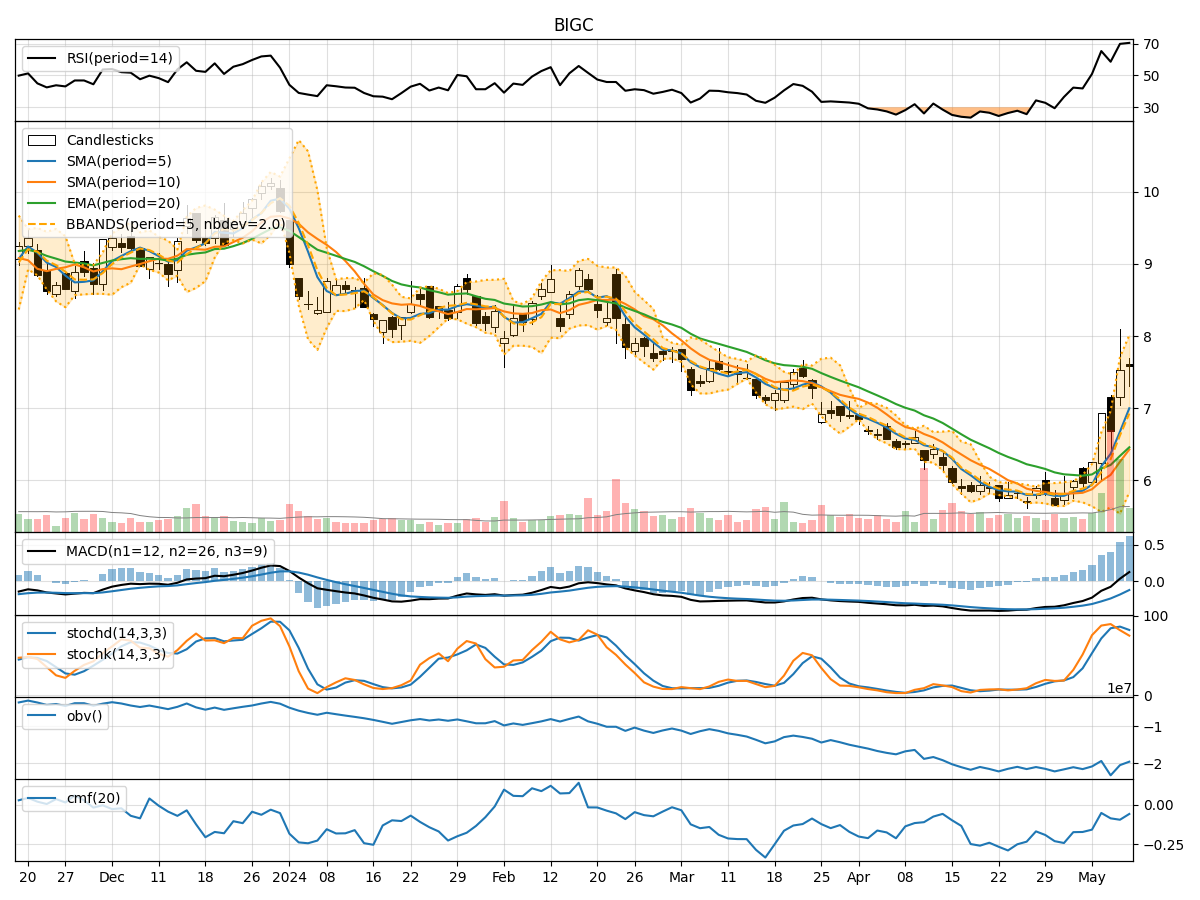
In analyzing the technical indicators for BIGC over the last 5 days, we will delve into the trend, momentum, volatility, and volume indicators to provide a comprehensive outlook on the possible stock price movement. By examining these key aspects, we aim to offer valuable insights and predictions for the upcoming days.
Trend Analysis:
- Moving Averages (MA): The 5-day Moving Average (MA) has been consistently increasing, indicating a bullish trend in the short term.
- MACD: The MACD line has been above the signal line for the past 5 days, suggesting a bullish momentum.
- EMA: The Exponential Moving Average has also been on an upward trajectory, supporting the bullish trend.
Momentum Analysis:
- RSI: The Relative Strength Index has been trending upwards, indicating increasing buying pressure.
- Stochastic Oscillator: Both %K and %D have shown a decline in the overbought zone, suggesting a potential reversal in momentum.
- Williams %R: The indicator has been moving towards the oversold territory, signaling a possible buying opportunity.
Volatility Analysis:
- Bollinger Bands: The widening of the Bollinger Bands suggests increased volatility in the stock price.
- Bollinger %B: The %B indicator has been fluctuating within a range, indicating potential consolidation.
Volume Analysis:
- On-Balance Volume (OBV): The OBV has shown a declining trend, indicating selling pressure in the stock.
- Chaikin Money Flow (CMF): The CMF has been negative, reflecting a lack of buying interest in the stock.
Key Observations:
- The trend indicators point towards a bullish sentiment in the short term.
- Momentum indicators suggest a potential reversal in momentum from overbought levels.
- Volatility indicators indicate increased price fluctuations, possibly leading to consolidation.
- Volume indicators reflect selling pressure and a lack of significant buying interest.
Conclusion:
Based on the analysis of the technical indicators, the stock price of BIGC is likely to experience some consolidation in the upcoming days. The bullish trend may face some resistance due to the potential reversal in momentum and lack of strong buying interest indicated by volume indicators. Traders should be cautious of the increased volatility and monitor key support and resistance levels for potential trading opportunities.