Technical Analysis of BKNG 2024-05-10
Overview:
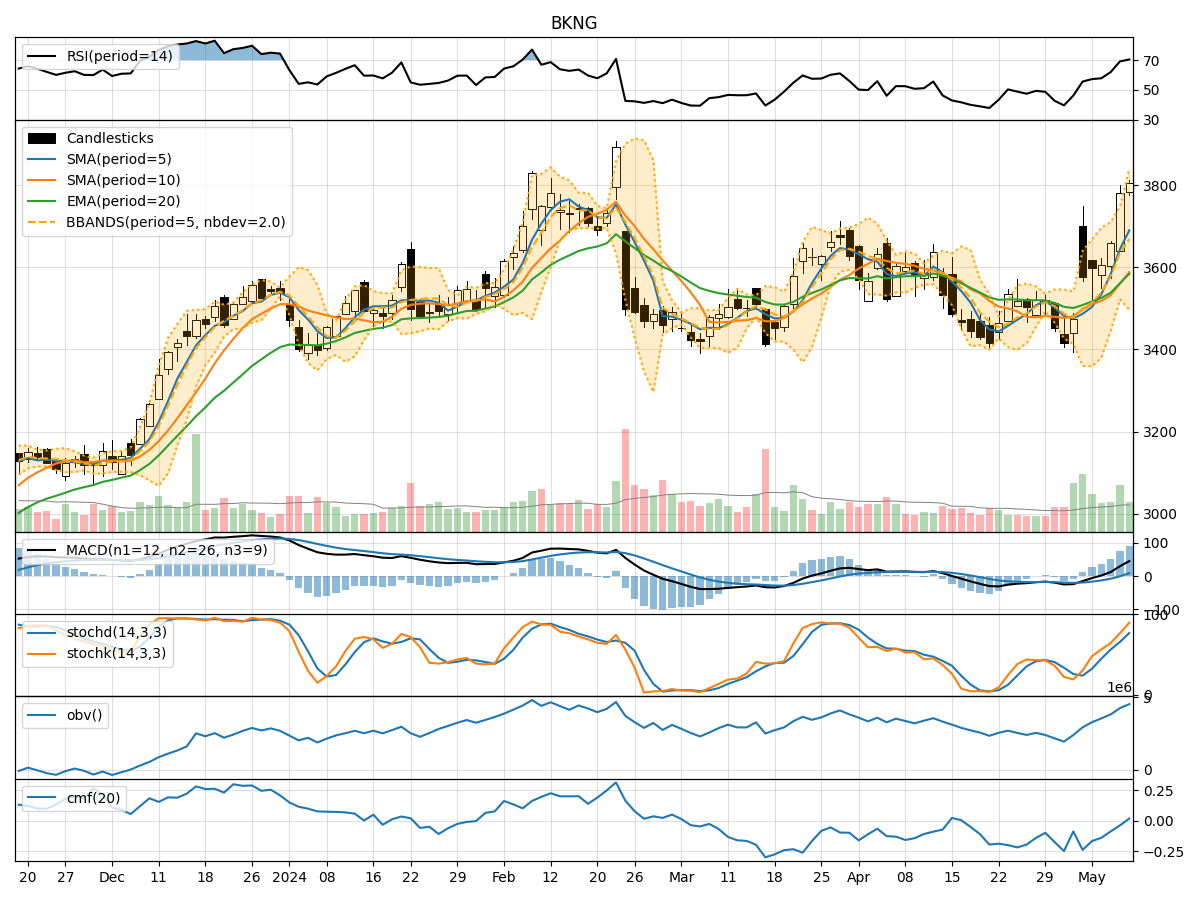
In analyzing the technical indicators for BKNG over the last 5 days, we will delve into the trend, momentum, volatility, and volume indicators to provide a comprehensive outlook on the possible stock price movement in the coming days.
Trend Analysis:
- Moving Averages (MA): The 5-day Moving Average has been consistently rising, indicating a bullish trend.
- MACD: The MACD line has been above the signal line for the past 5 days, suggesting a bullish momentum.
- EMA: The Exponential Moving Average has also been trending upwards, supporting the bullish sentiment.
Momentum Analysis:
- RSI: The Relative Strength Index has been increasing and is currently in the overbought territory, signaling a strong bullish momentum.
- Stochastic Oscillator: Both %K and %D lines are in the overbought zone, indicating a potential reversal or consolidation.
- Williams %R: The indicator is close to the oversold region, suggesting a possible reversal in the short term.
Volatility Analysis:
- Bollinger Bands: The stock price has been consistently trading above the middle Bollinger Band, indicating an uptrend.
- Bollinger %B: The %B indicator is above 0.5, suggesting bullish momentum.
- Bollinger Band Width: The Band Width has been expanding, indicating increasing volatility in the stock price.
Volume Analysis:
- On-Balance Volume (OBV): The OBV has been fluctuating but has shown a slight increase in the last trading day, indicating some buying pressure.
- Chaikin Money Flow (CMF): The CMF has been negative, suggesting a lack of buying pressure in the stock.
Key Observations:
- The trend indicators, momentum indicators, and volatility indicators all point towards a bullish sentiment in the short term.
- However, the stochastic oscillator nearing overbought levels and the Williams %R indicator close to oversold levels suggest a potential consolidation or minor pullback in the coming days.
- The volume indicators do not strongly support the bullish sentiment, with the CMF indicating a lack of buying pressure.
Conclusion:
Based on the analysis of the technical indicators, the next few days for BKNG are likely to see upward movement in the stock price, supported by the bullish trend and momentum indicators. However, traders should be cautious of a potential consolidation or minor pullback as indicated by the stochastic oscillator and Williams %R. It is essential to monitor the volume closely for confirmation of sustained buying pressure.