Technical Analysis of CCCC 2024-05-31
Overview:
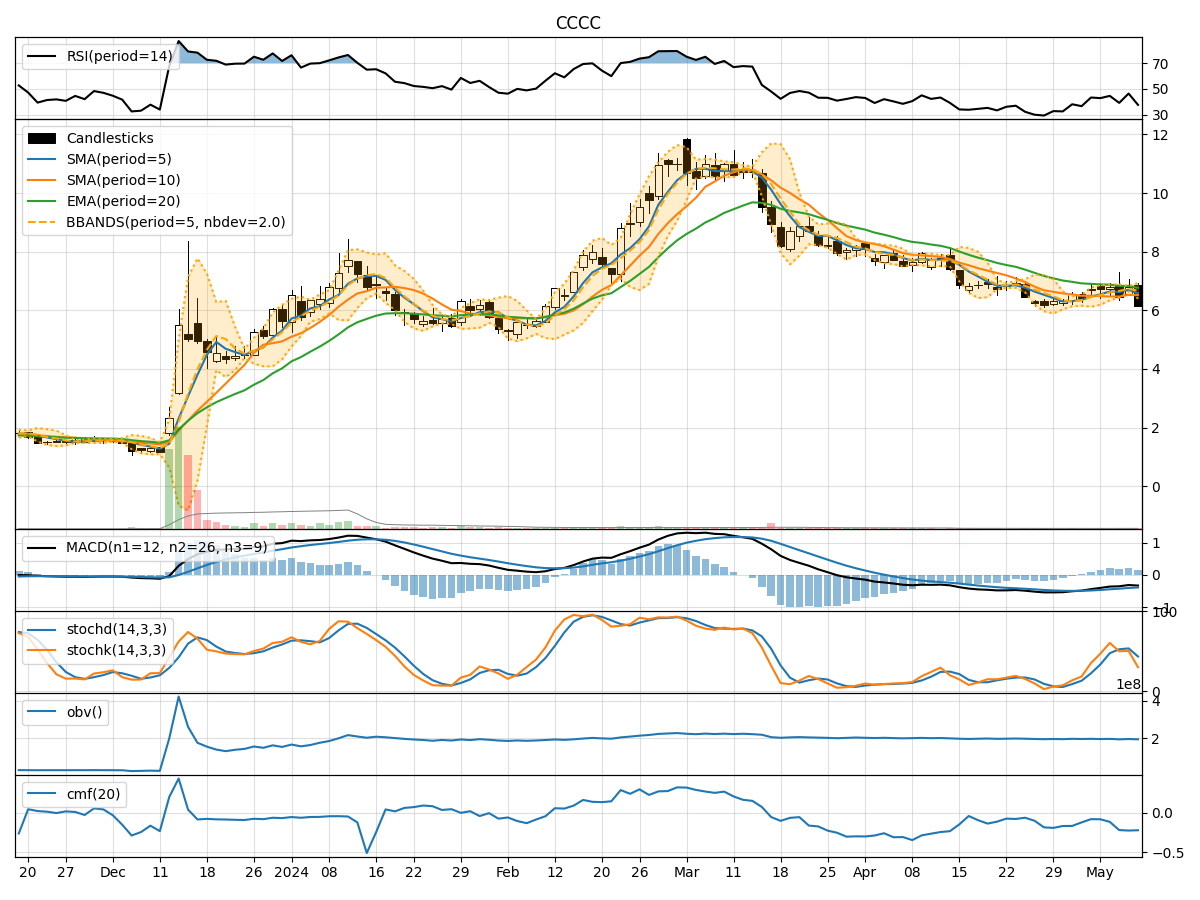
In analyzing the technical indicators for CCCC stock over the last 5 days, we will delve into the trend, momentum, volatility, and volume indicators to provide a comprehensive outlook on the possible stock price movement in the coming days. By examining these key indicators, we aim to offer valuable insights and predictions for potential investors.
Trend Analysis:
- Moving Averages (MA): The 5-day moving average has been consistently decreasing, indicating a downward trend in the stock price.
- MACD: The MACD line has been negative, suggesting bearish momentum in the stock.
- EMA: The exponential moving average has also been declining, reinforcing the bearish sentiment in the stock.
Momentum Analysis:
- RSI: The Relative Strength Index has been decreasing, showing a weakening momentum in the stock.
- Stochastic Oscillator: Both %K and %D have been trending downwards, indicating a bearish momentum.
- Williams %R: The indicator has been in oversold territory, signaling a potential reversal or continuation of the downtrend.
Volatility Analysis:
- Bollinger Bands: The bands have been narrowing, suggesting decreasing volatility in the stock.
- Bollinger %B: The %B indicator has been decreasing, indicating a potential oversold condition.
- Average True Range (ATR): ATR has been decreasing, reflecting lower volatility in the stock.
Volume Analysis:
- On-Balance Volume (OBV): The OBV has been consistently negative, indicating selling pressure in the stock.
- Chaikin Money Flow (CMF): The CMF has been decreasing, suggesting outflow of money from the stock.
Key Observations:
- The stock is currently in a downtrend based on moving averages and MACD.
- Momentum indicators such as RSI and Stochastic Oscillator are showing bearish signals.
- Volatility is decreasing, which may indicate a potential consolidation phase.
- Volume indicators reflect selling pressure and a decrease in money flow into the stock.
Conclusion:
Based on the analysis of the technical indicators, the next few days' possible stock price movement for CCCC is likely to continue downwards. The bearish trend, supported by momentum indicators and volume analysis, suggests that investors should exercise caution and consider potential short positions or staying on the sidelines until a clear reversal pattern emerges. The decreasing volatility may lead to a period of consolidation before any significant price movement. Overall, the outlook for CCCC stock in the short term appears bearish.