Technical Analysis of CELC 2024-05-10
Overview:
In analyzing the technical indicators for CELC over the last 5 days, we will delve into the trend, momentum, volatility, and volume indicators to provide a comprehensive outlook on the possible stock price movement. By examining these key aspects, we aim to offer valuable insights and predictions for the upcoming days.
Trend Indicators:
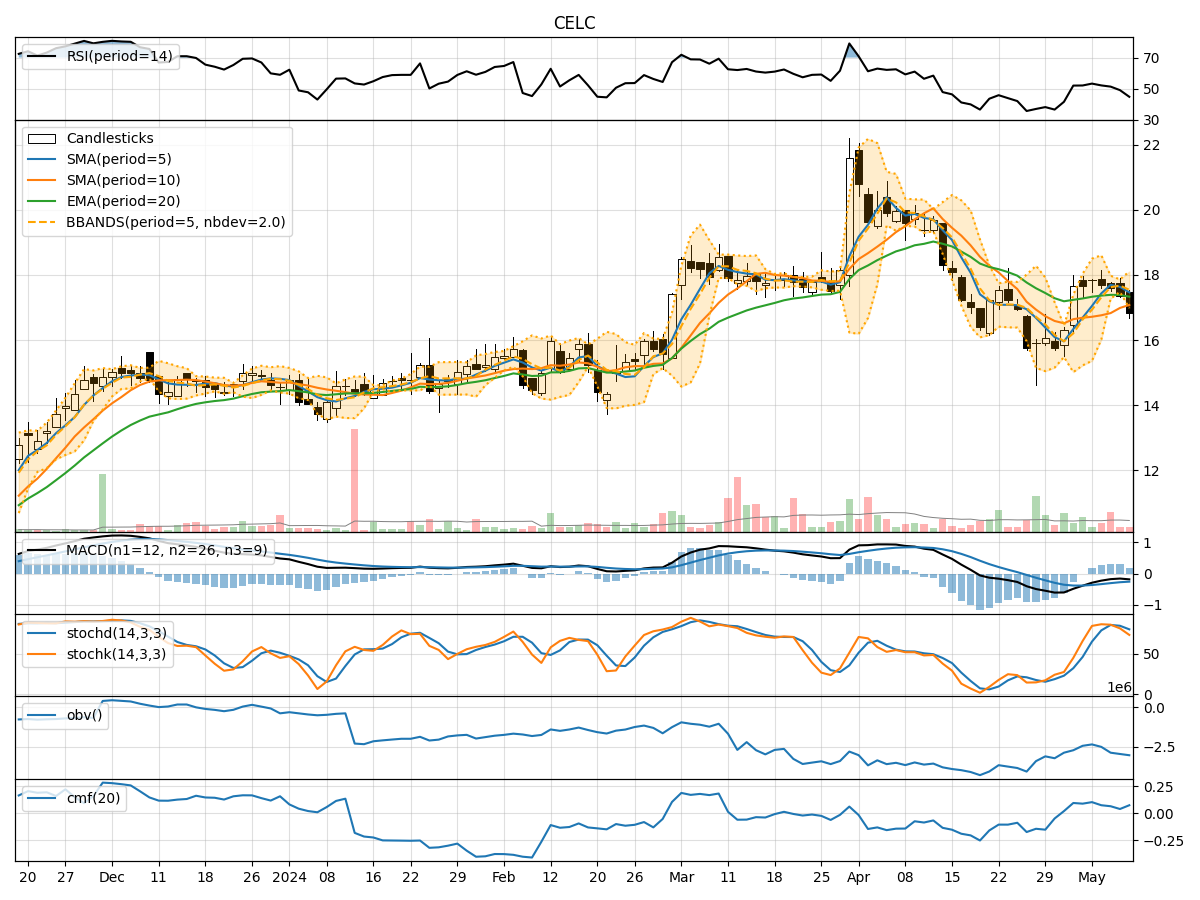
- Moving Averages (MA): The 5-day MA has been consistently above the closing prices, indicating a short-term uptrend.
- MACD: The MACD line has been below the signal line, suggesting a bearish momentum.
- EMA: The EMA has been relatively stable, reflecting a neutral trend.
Momentum Indicators:
- RSI: The RSI has been declining, indicating weakening momentum.
- Stochastic Oscillator: Both %K and %D have been decreasing, signaling a potential bearish trend.
- Williams %R: The indicator has been in oversold territory, suggesting a possible reversal.
Volatility Indicators:
- Bollinger Bands: The bands have been narrowing, indicating decreasing volatility.
- Bollinger %B: The %B has been fluctuating within a tight range, reflecting consolidation.
- Average True Range (ATR): The ATR has been decreasing, suggesting reduced price fluctuations.
Volume Indicators:
- On-Balance Volume (OBV): The OBV has been declining, indicating selling pressure.
- Chaikin Money Flow (CMF): The CMF has been decreasing, suggesting outflows from the stock.
Key Observations:
- The trend indicators show a mixed picture with a short-term uptrend but bearish momentum.
- Momentum indicators point towards a weakening momentum and potential bearish trend.
- Volatility indicators indicate decreasing volatility and consolidation.
- Volume indicators reflect selling pressure and outflows from the stock.
Conclusion:
Based on the analysis of the technical indicators, the next few days for CELC are likely to see further downside movement. The bearish momentum, weakening indicators, and selling pressure suggest a potential continuation of the current trend. Traders and investors should exercise caution and consider short-term strategies to navigate the expected downward movement in the stock price.