Technical Analysis of CGEM 2024-05-10
Overview:
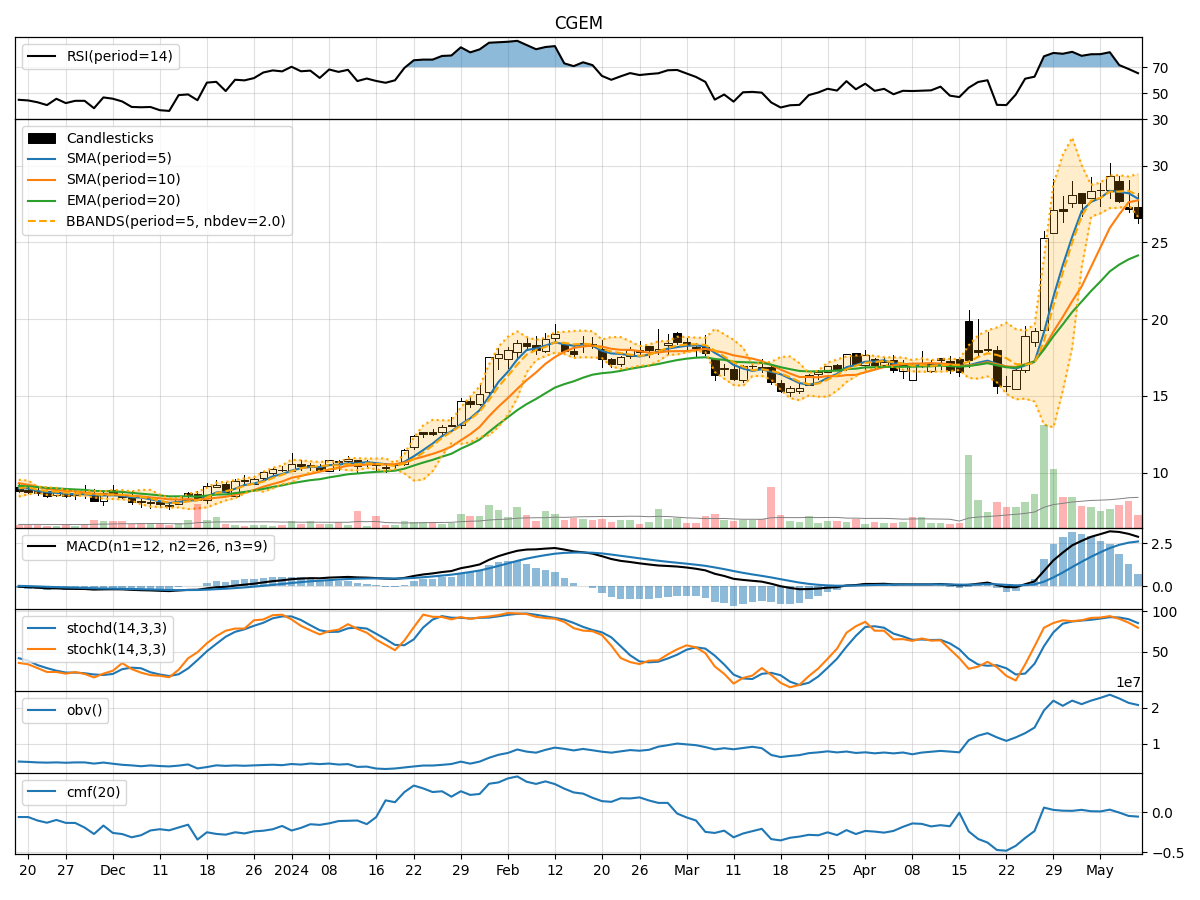
In analyzing the technical indicators for CGEM over the last 5 days, we will delve into the trend, momentum, volatility, and volume indicators to provide a comprehensive outlook on the possible stock price movement. By examining key metrics such as moving averages, MACD, RSI, Bollinger Bands, and OBV, we aim to offer valuable insights and predictions for the upcoming days.
Trend Analysis:
- Moving Averages (MA): The 5-day MA has been fluctuating around the closing prices, indicating short-term price trends. The SMA(10) and EMA(20) have been on an upward trajectory, suggesting a bullish sentiment.
- MACD: The MACD line has been above the signal line, indicating a bullish trend. The MACD histogram has been positive, further supporting the bullish momentum.
Momentum Analysis:
- RSI: The RSI has been in the overbought territory, suggesting a potential reversal or consolidation in the stock price.
- Stochastic Oscillator: Both %K and %D have been relatively high, indicating an overbought condition. The Williams %R is also in the oversold region, signaling a possible reversal.
Volatility Analysis:
- Bollinger Bands (BB): The stock price has been trading within the bands, with the lower band providing support. The narrowing of the bands indicates decreasing volatility.
- Bollinger %B: The %B indicator has been hovering around 0.1, suggesting the stock is trading close to the lower band.
Volume Analysis:
- On-Balance Volume (OBV): The OBV has been declining, indicating selling pressure in the stock.
- Chaikin Money Flow (CMF): The CMF has been negative, reflecting a bearish money flow into the stock.
Conclusion:
Based on the analysis of the technical indicators, the stock of CGEM is likely to experience further downward movement in the next few days. The overbought RSI, high stochastic levels, and negative OBV and CMF suggest a bearish sentiment. The narrowing Bollinger Bands and proximity to the lower band also indicate a potential downward trend. Traders should exercise caution and consider shorting or staying on the sidelines until a clearer bullish signal emerges.