Technical Analysis of CRWD 2024-05-10
Overview:
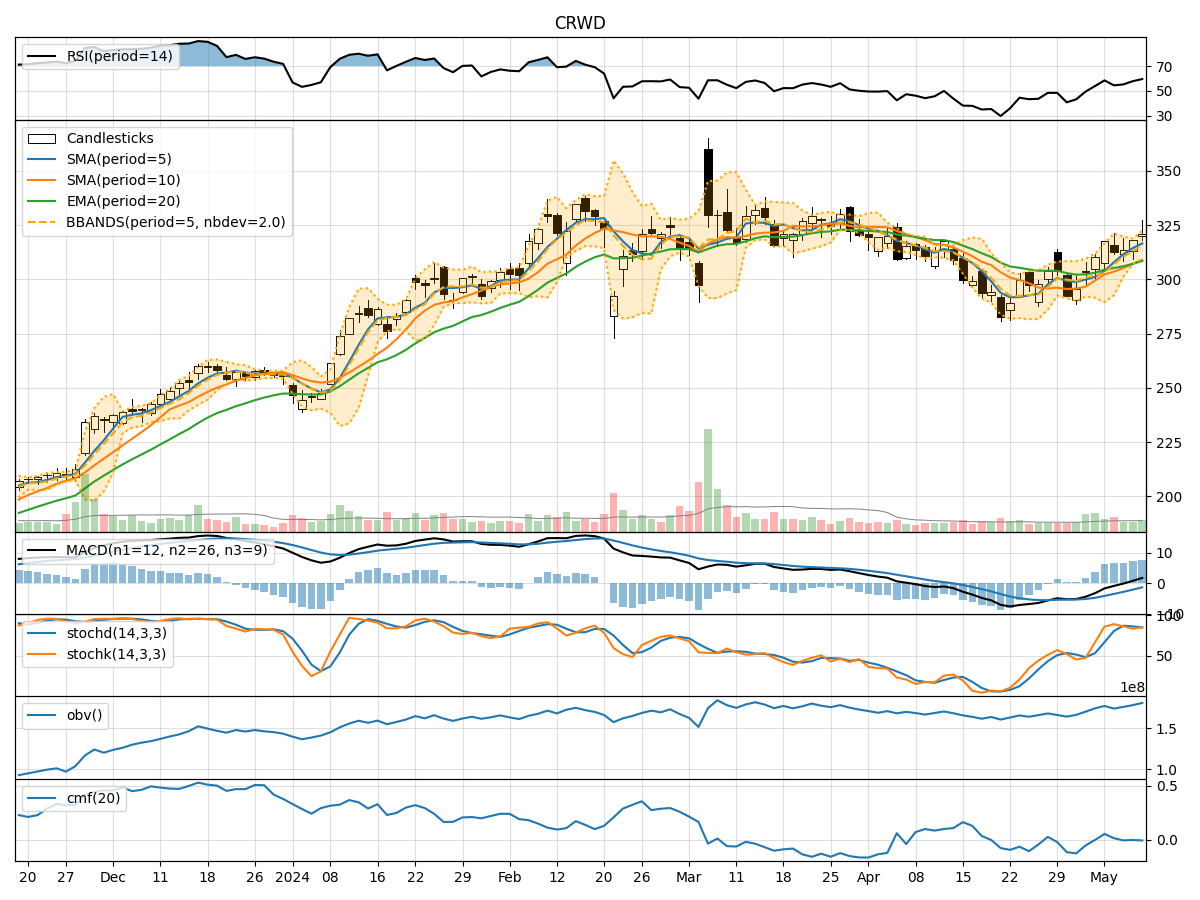
In analyzing the technical indicators for CRWD over the last 5 days, we will delve into the trend, momentum, volatility, and volume indicators to provide a comprehensive outlook on the possible stock price movement in the coming days.
Trend Analysis:
- Moving Averages (MA): The 5-day Moving Average (MA) has been consistently rising, indicating a bullish trend in the short term.
- MACD: The MACD line has been increasing, crossing above the signal line, suggesting a bullish momentum.
- RSI: The Relative Strength Index (RSI) has been fluctuating around the overbought territory, indicating strong buying pressure.
Momentum Analysis:
- Stochastic Oscillator: Both %K and %D lines have been in the overbought zone, suggesting a potential reversal or consolidation.
- Williams %R: The Williams %R is in the oversold region, indicating a possible buying opportunity.
Volatility Analysis:
- Bollinger Bands (BB): The stock price has been trading within the upper Bollinger Band, indicating an overbought condition.
- BB% (Bollinger Band %B): The BB% has been above 0.8, suggesting a potential reversal or pullback.
Volume Analysis:
- On-Balance Volume (OBV): The OBV has been increasing, indicating accumulation by investors.
- Chaikin Money Flow (CMF): The CMF has been positive, reflecting buying pressure in the stock.
Key Observations:
- The trend indicators suggest a bullish sentiment in the short term.
- Momentum indicators show a mix of overbought and oversold conditions, signaling a potential reversal or consolidation.
- Volatility indicators point towards an overbought market condition.
- Volume indicators indicate accumulation and buying pressure in the stock.
Conclusion:
Based on the analysis of the technical indicators, the next few days' possible stock price movement for CRWD is likely to experience a short-term pullback or consolidation. The stock has been in overbought territory, and the momentum indicators suggest a potential reversal. Traders may consider taking profits or waiting for a better entry point before considering long positions. Exercise caution and wait for confirmation of a new trend direction before making significant trading decisions.