Technical Analysis of CYTK 2024-05-31
Overview:
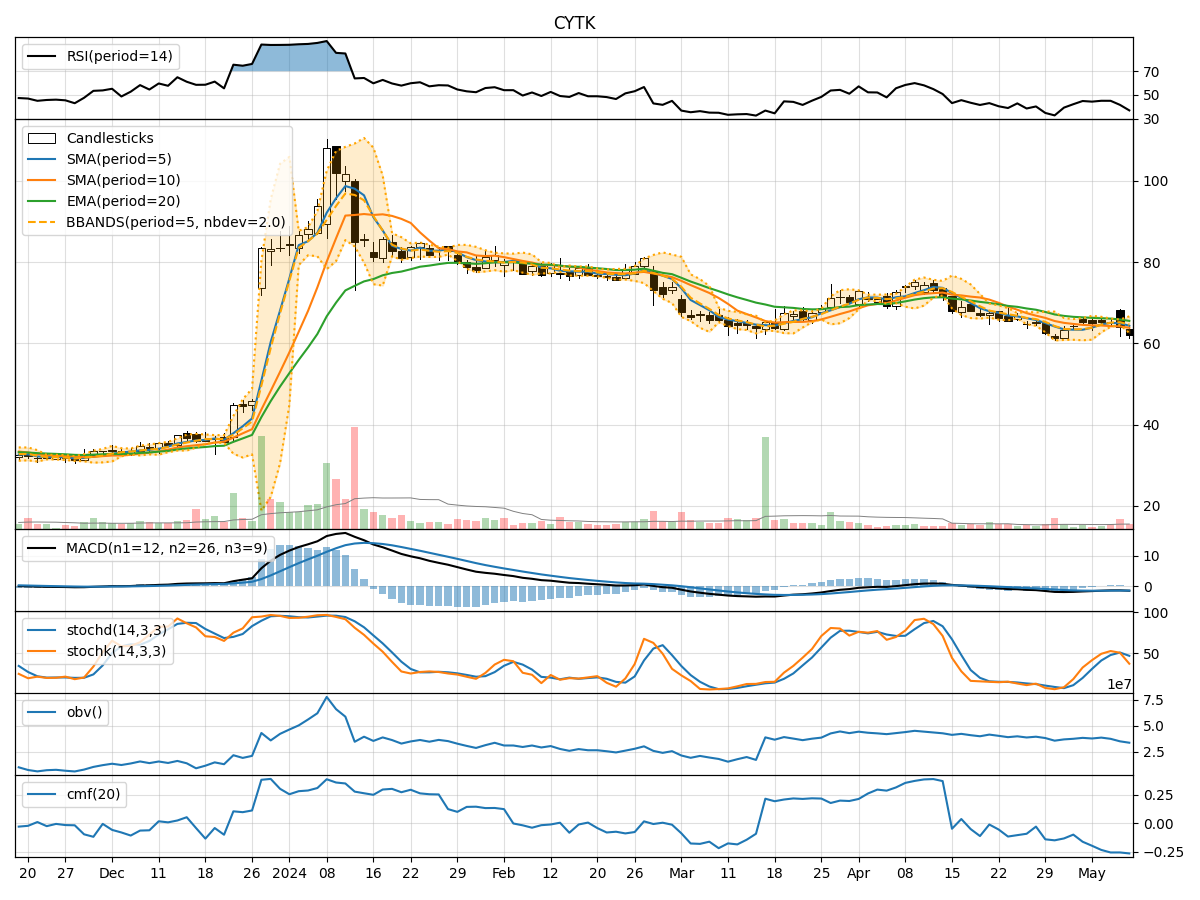
In analyzing the technical indicators for CYTK over the last 5 days, we will delve into the trend, momentum, volatility, and volume indicators to provide a comprehensive outlook on the possible stock price movement in the coming days. By examining these key indicators, we aim to offer valuable insights and predictions to guide your investment decisions.
Trend Analysis:
- Moving Averages (MA): The 5-day moving average has been consistently decreasing, indicating a downward trend in the stock price.
- MACD: The MACD line has been negative and decreasing, suggesting bearish momentum in the stock.
- EMA: The exponential moving average has been declining, reinforcing the bearish sentiment in the stock.
Momentum Analysis:
- RSI: The Relative Strength Index has been relatively low, indicating oversold conditions in the stock.
- Stochastic Oscillator: Both %K and %D have been low, signaling potential oversold levels.
- Williams %R: The indicator has been in the oversold territory, suggesting a possible reversal in the stock price.
Volatility Analysis:
- Bollinger Bands: The stock price has moved below the lower Bollinger Band, indicating potential oversold conditions.
- Bollinger %B: The %B indicator is above 0.5, suggesting a potential bounce back in the stock price.
Volume Analysis:
- On-Balance Volume (OBV): The OBV has been negative, indicating selling pressure in the stock.
- Chaikin Money Flow (CMF): The CMF has been negative, reflecting a lack of buying interest in the stock.
Key Observations:
- The stock is currently in a downtrend based on moving averages and MACD.
- Momentum indicators suggest the stock is oversold and may see a potential reversal.
- Volatility indicators point towards potential oversold conditions and a bounce back.
- Volume indicators indicate selling pressure and a lack of buying interest in the stock.
Conclusion:
Based on the analysis of the technical indicators, the next few days for CYTK stock may see a potential reversal in the downtrend. The stock is currently oversold, and with volatility indicators suggesting a bounce back, there could be a short-term bullish movement in the stock price. However, investors should closely monitor the momentum and volume indicators for confirmation of a trend reversal.